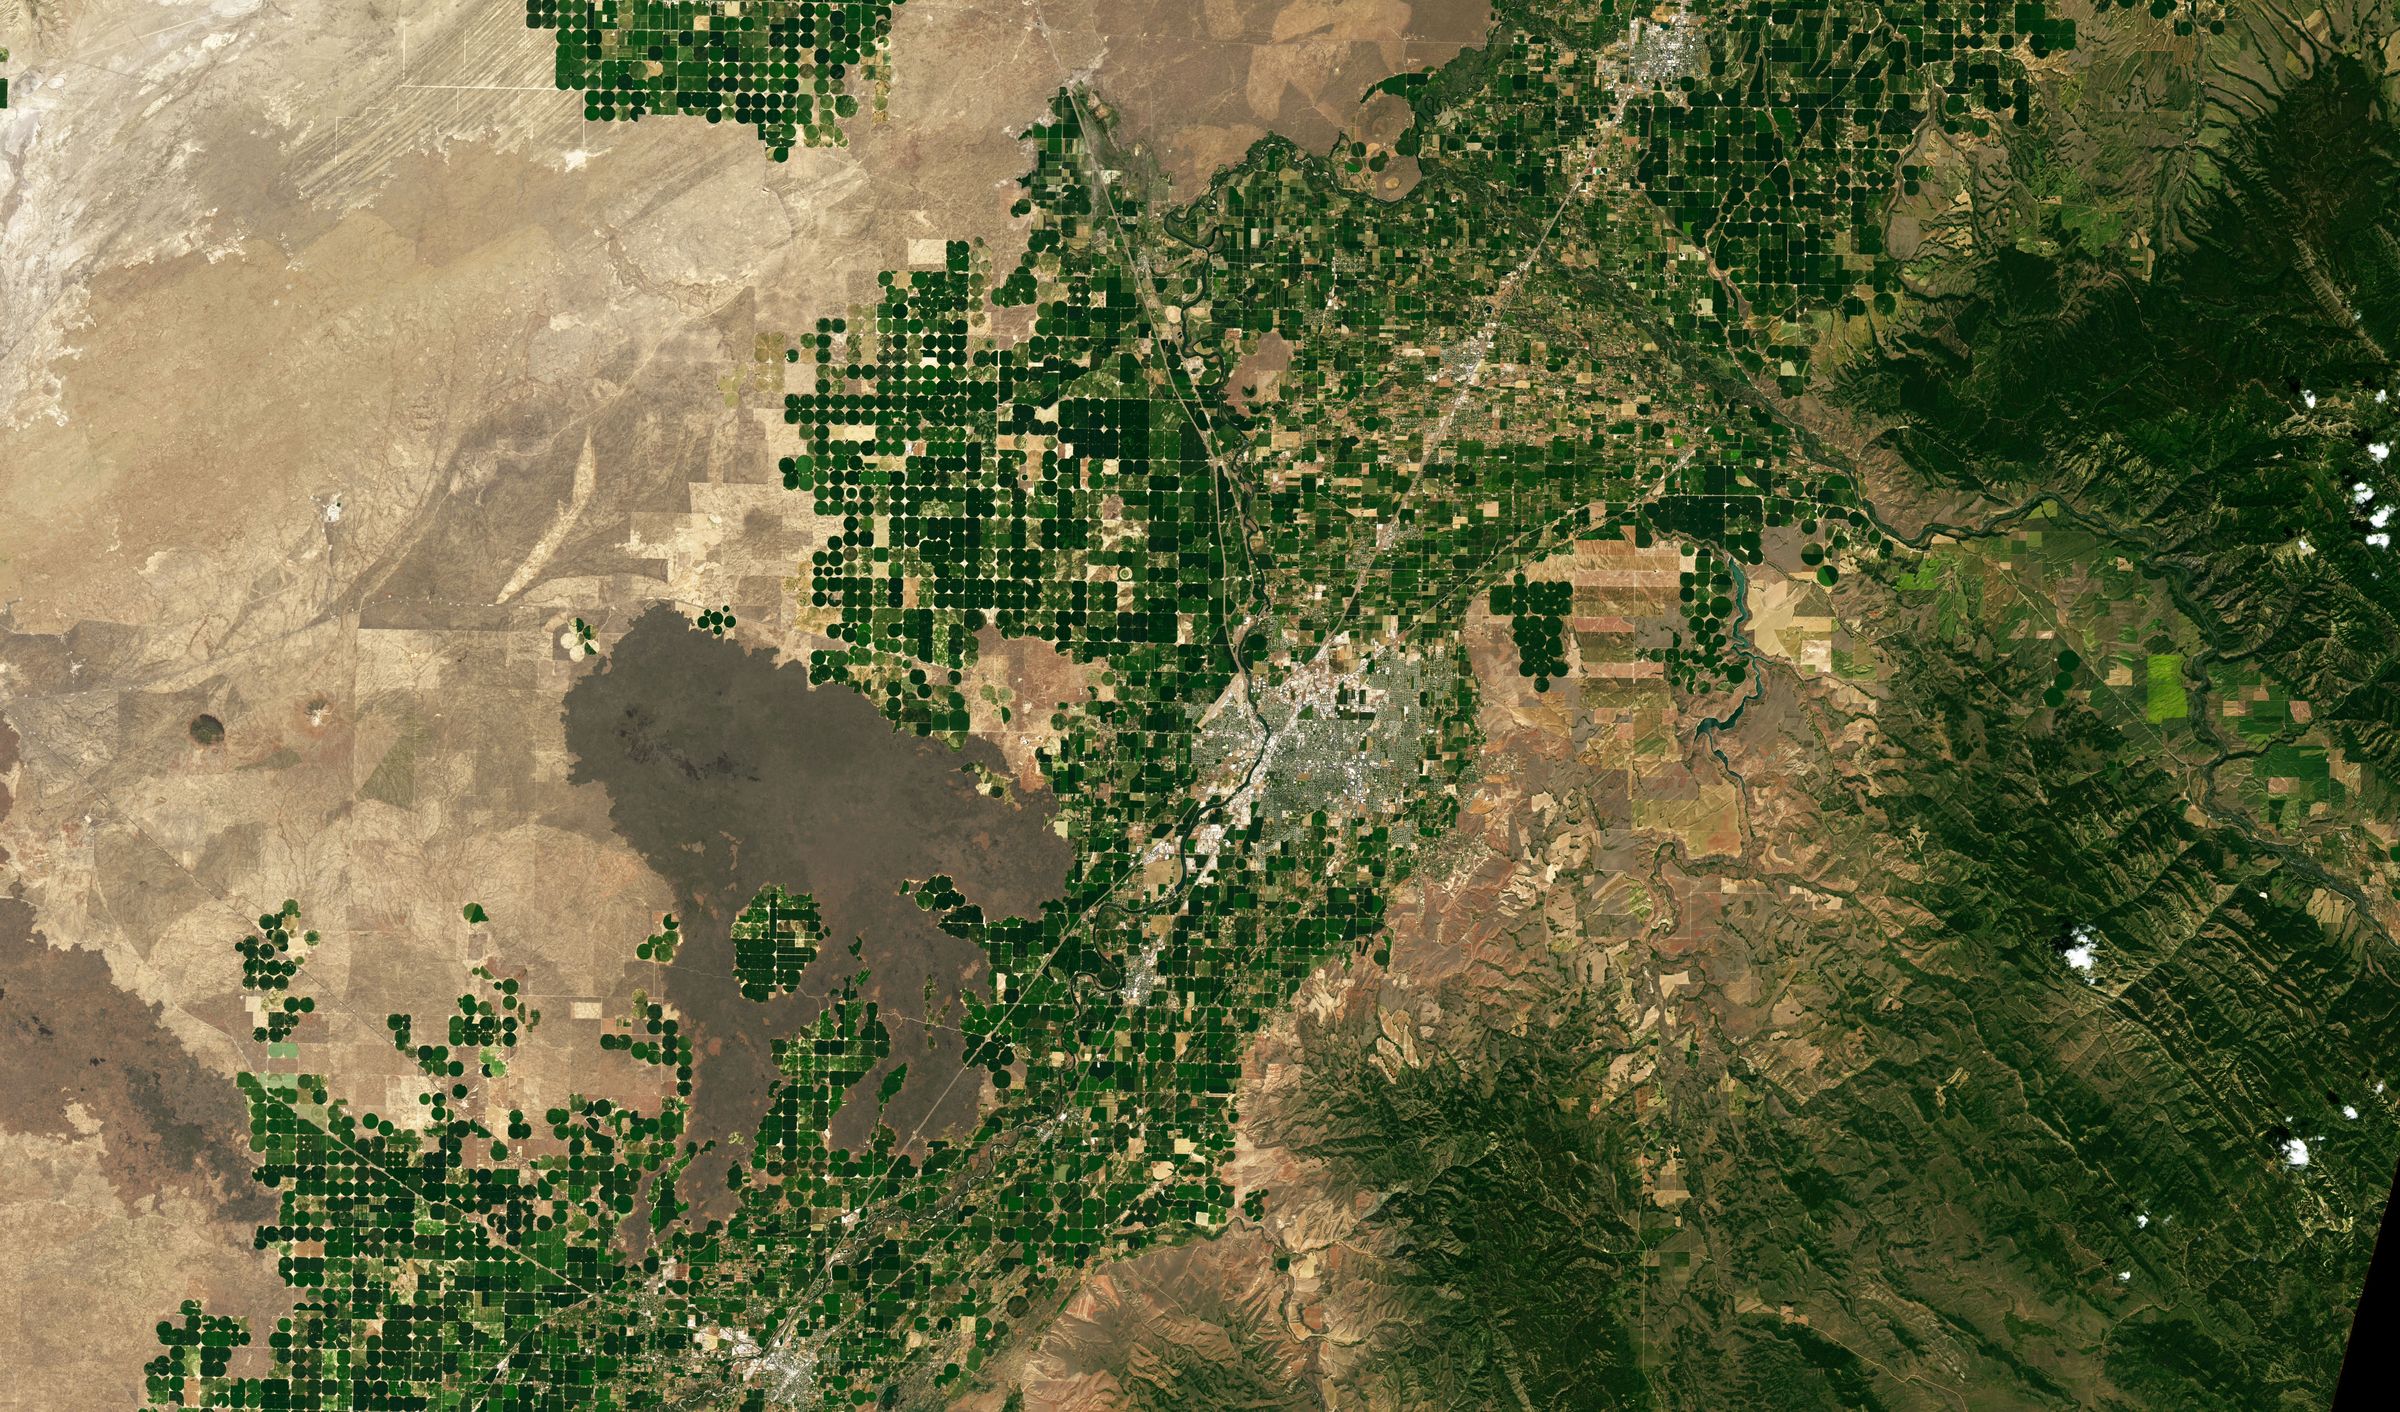
Satellite view of eastern Idaho: hundreds of green irrigated circles surrounded by tan desert and dark lava fields.
USBR AgriMet weather network · Pacific Northwest

How representative is the Pacific Northwest's Evaporative Demand measurement network?

AgriMet stations supply a standardized measure of evaporative demand, i.e., daily reference evapotranspiration (ETref) for irrigation scheduling and water management. We assessed the network on two aspects: spatial adequacy (are stations located where irrigated cropland needs them?) and station aridity (do station surroundings meet the standardized reference-surface conditions?).

Irrigated center pivots in desert and lava fields near Idaho Falls, July 2022. NASA Earth Observatory image by Lauren Dauphin, using Landsat data from the U.S. Geological Survey.

Background

Reference ET and who uses it

Each AgriMet station records air temperature, humidity, solar radiation and wind speed. From these, the ASCE-EWRI standardized Penman–Monteith equation computes reference evapotranspiration: the water use of a standardized reference (hypothetical) crop under that day's weather.

Crop water use is then estimated as crop ET = Kc × ETref, where the crop coefficient Kc accounts for crop type and growth stage. Irrigation scheduling, water-right determinations, irrigation system design and gridded ET products all depend on ETref, so any error in ETref carries into each of them.

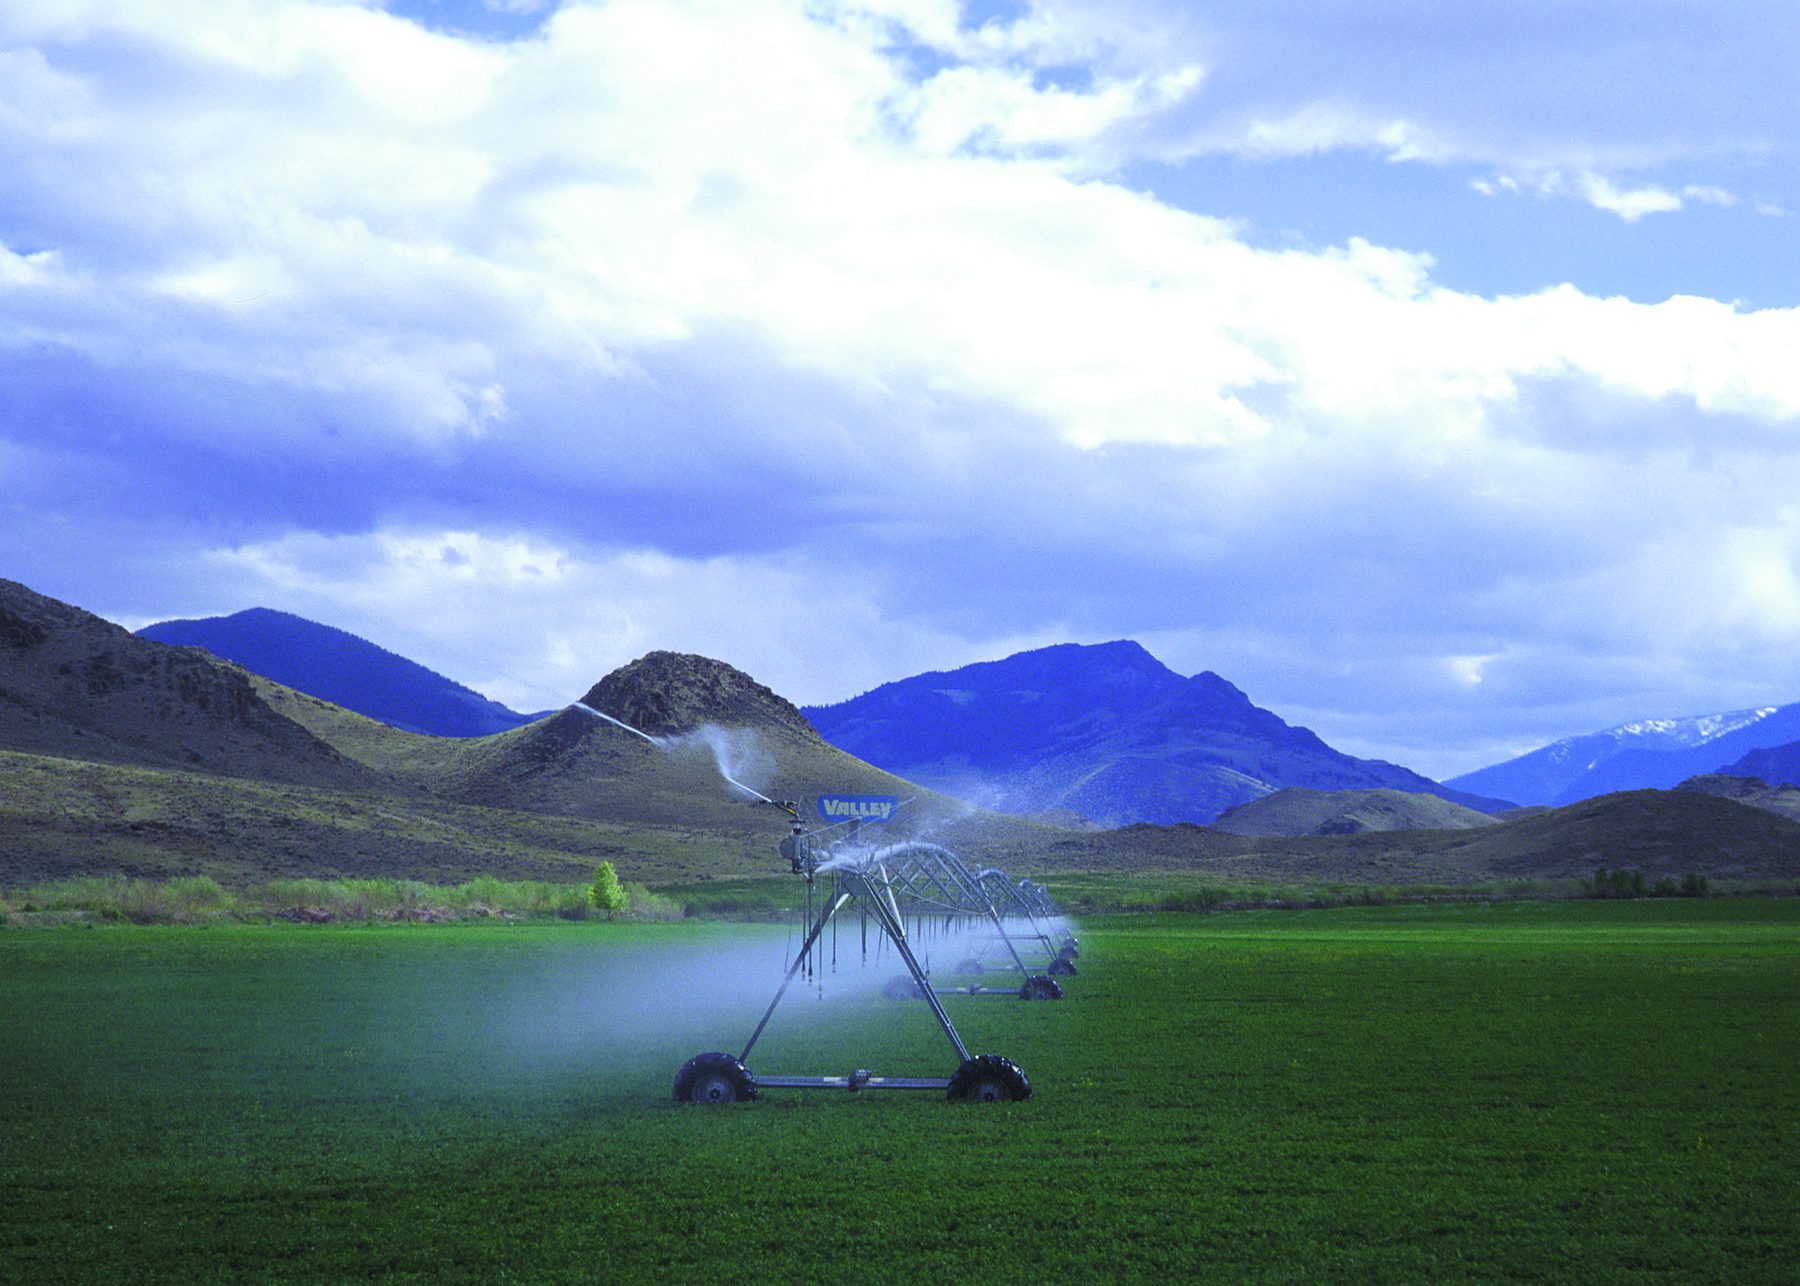
A center-pivot sprinkler watering a green field below mountains in Idaho.
Center-pivot irrigation, Idaho. To be efficient, run times are based on crop ET, which is computed from ETref. Photo: Mark Olson, USDA NRCS (public domain).
Evapotranspiration (ET)

Water lost to the atmosphere by evaporation from soil and plant surfaces plus transpiration through leaves.

Reference ET (ETref)

ET from a standardized reference surface under local weather. It expresses the evaporative demand of the atmosphere, independent of crop type.

Standardized reference surface

An extensive, uniform, actively growing crop that fully shades the ground and is not short of water: clipped grass 0.12 m tall (ETos) or alfalfa 0.50 m tall (ETrs).

Definitions follow ASCE-EWRI (2005) and FAO Irrigation and Drainage Paper 56 (Allen et al., 1998).

Two assessments

Adequacy, and representativeness of the station surroundings

ETref from a station is useful only where it represents the irrigated fields it serves. That depends on where stations sit relative to cropland, and on whether each station's surroundings match the reference surface the equation assumes.

Part 1 · Spatial adequacy

Are stations located where cropland needs them?

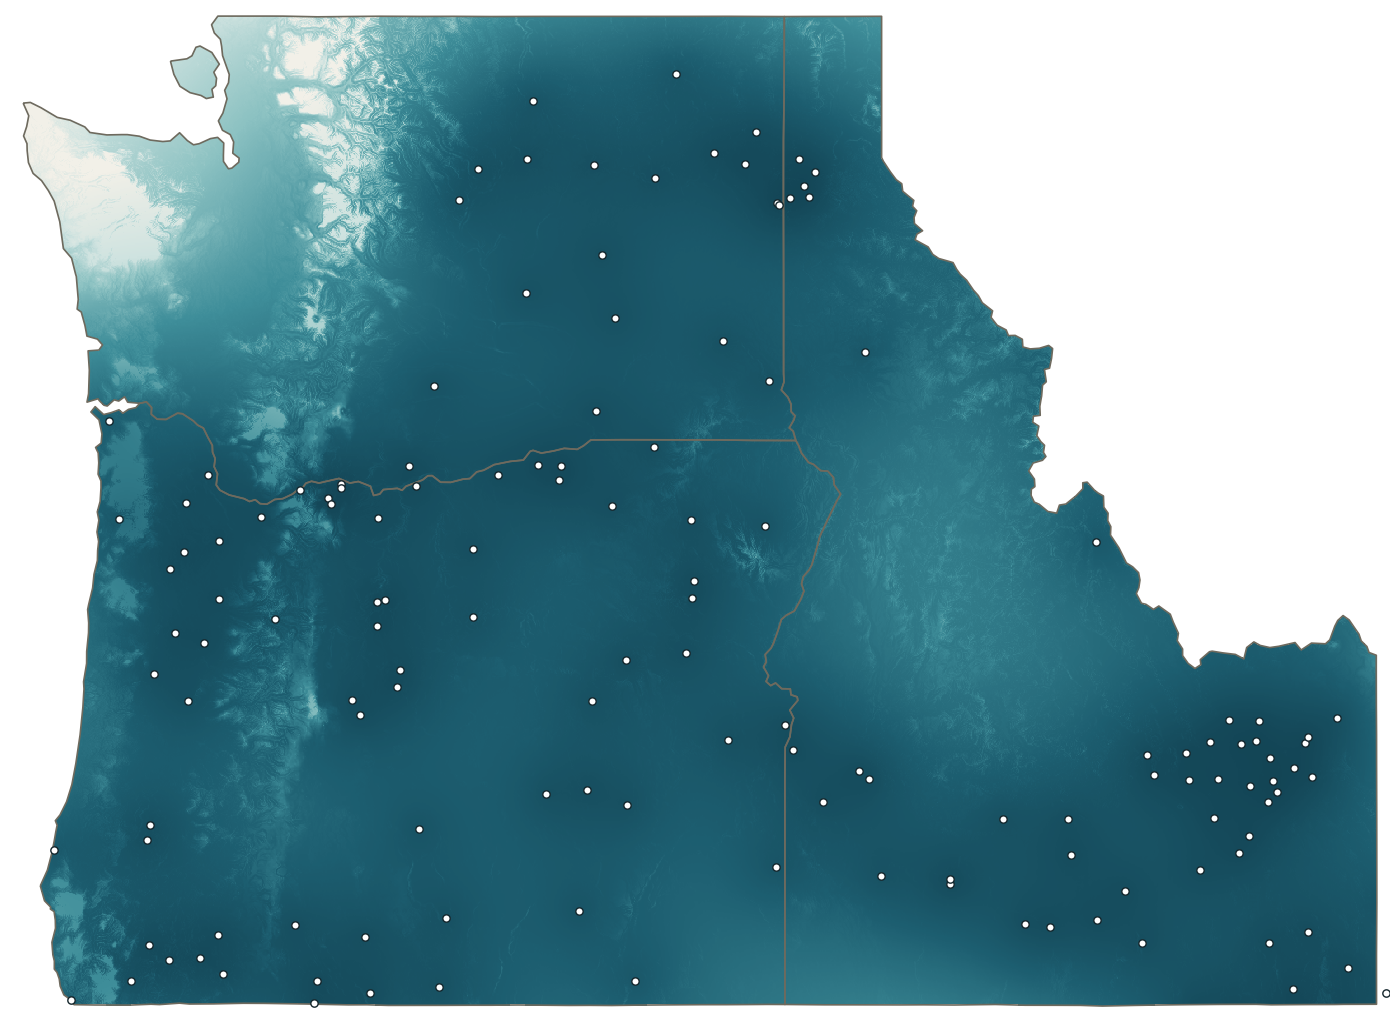
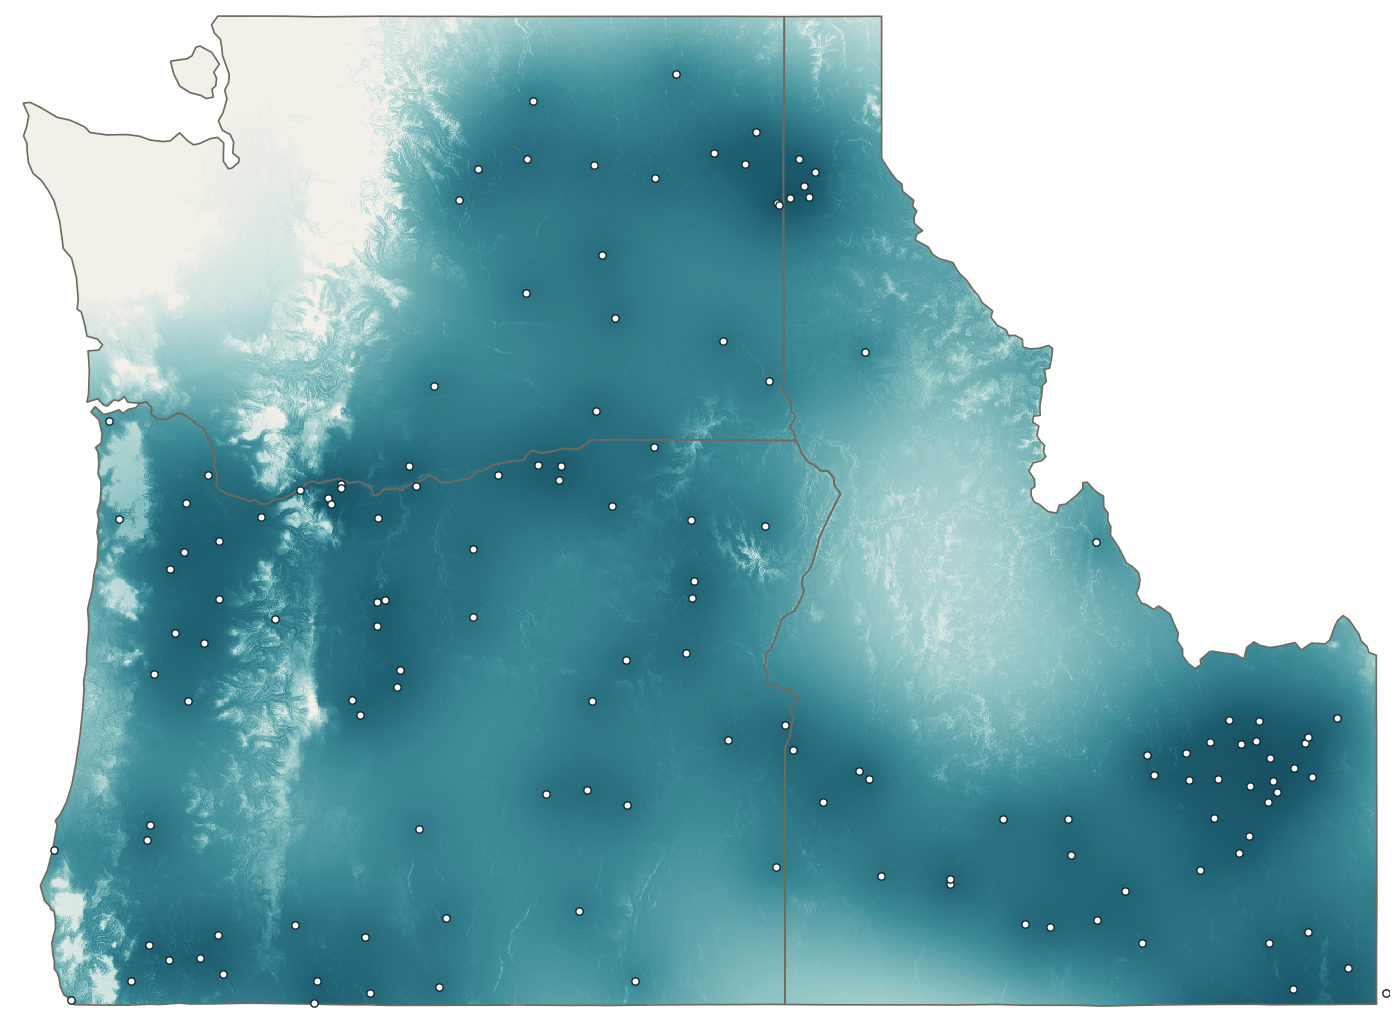
Geostatistical mapping of ETrs estimation confidence for every ~1 km cell across Oregon, Idaho and Washington, using 140 stations and 36 years of daily data.

Part 2 · Station surroundings

Do station surroundings meet reference conditions?

Satellite vegetation and land-cover indicators combined with nighttime humidity indicators for 197 stations in eight states, with records up to 45 years.

197
stations evaluated across 8 western states
1980–2024
period of daily station records
1 million+
~1 km grid cells mapped for estimation confidence
10 m
Sentinel-2 resolution for vegetation and land cover around each station
Part 1 · Spatial adequacy

Are stations located where cropland needs them?

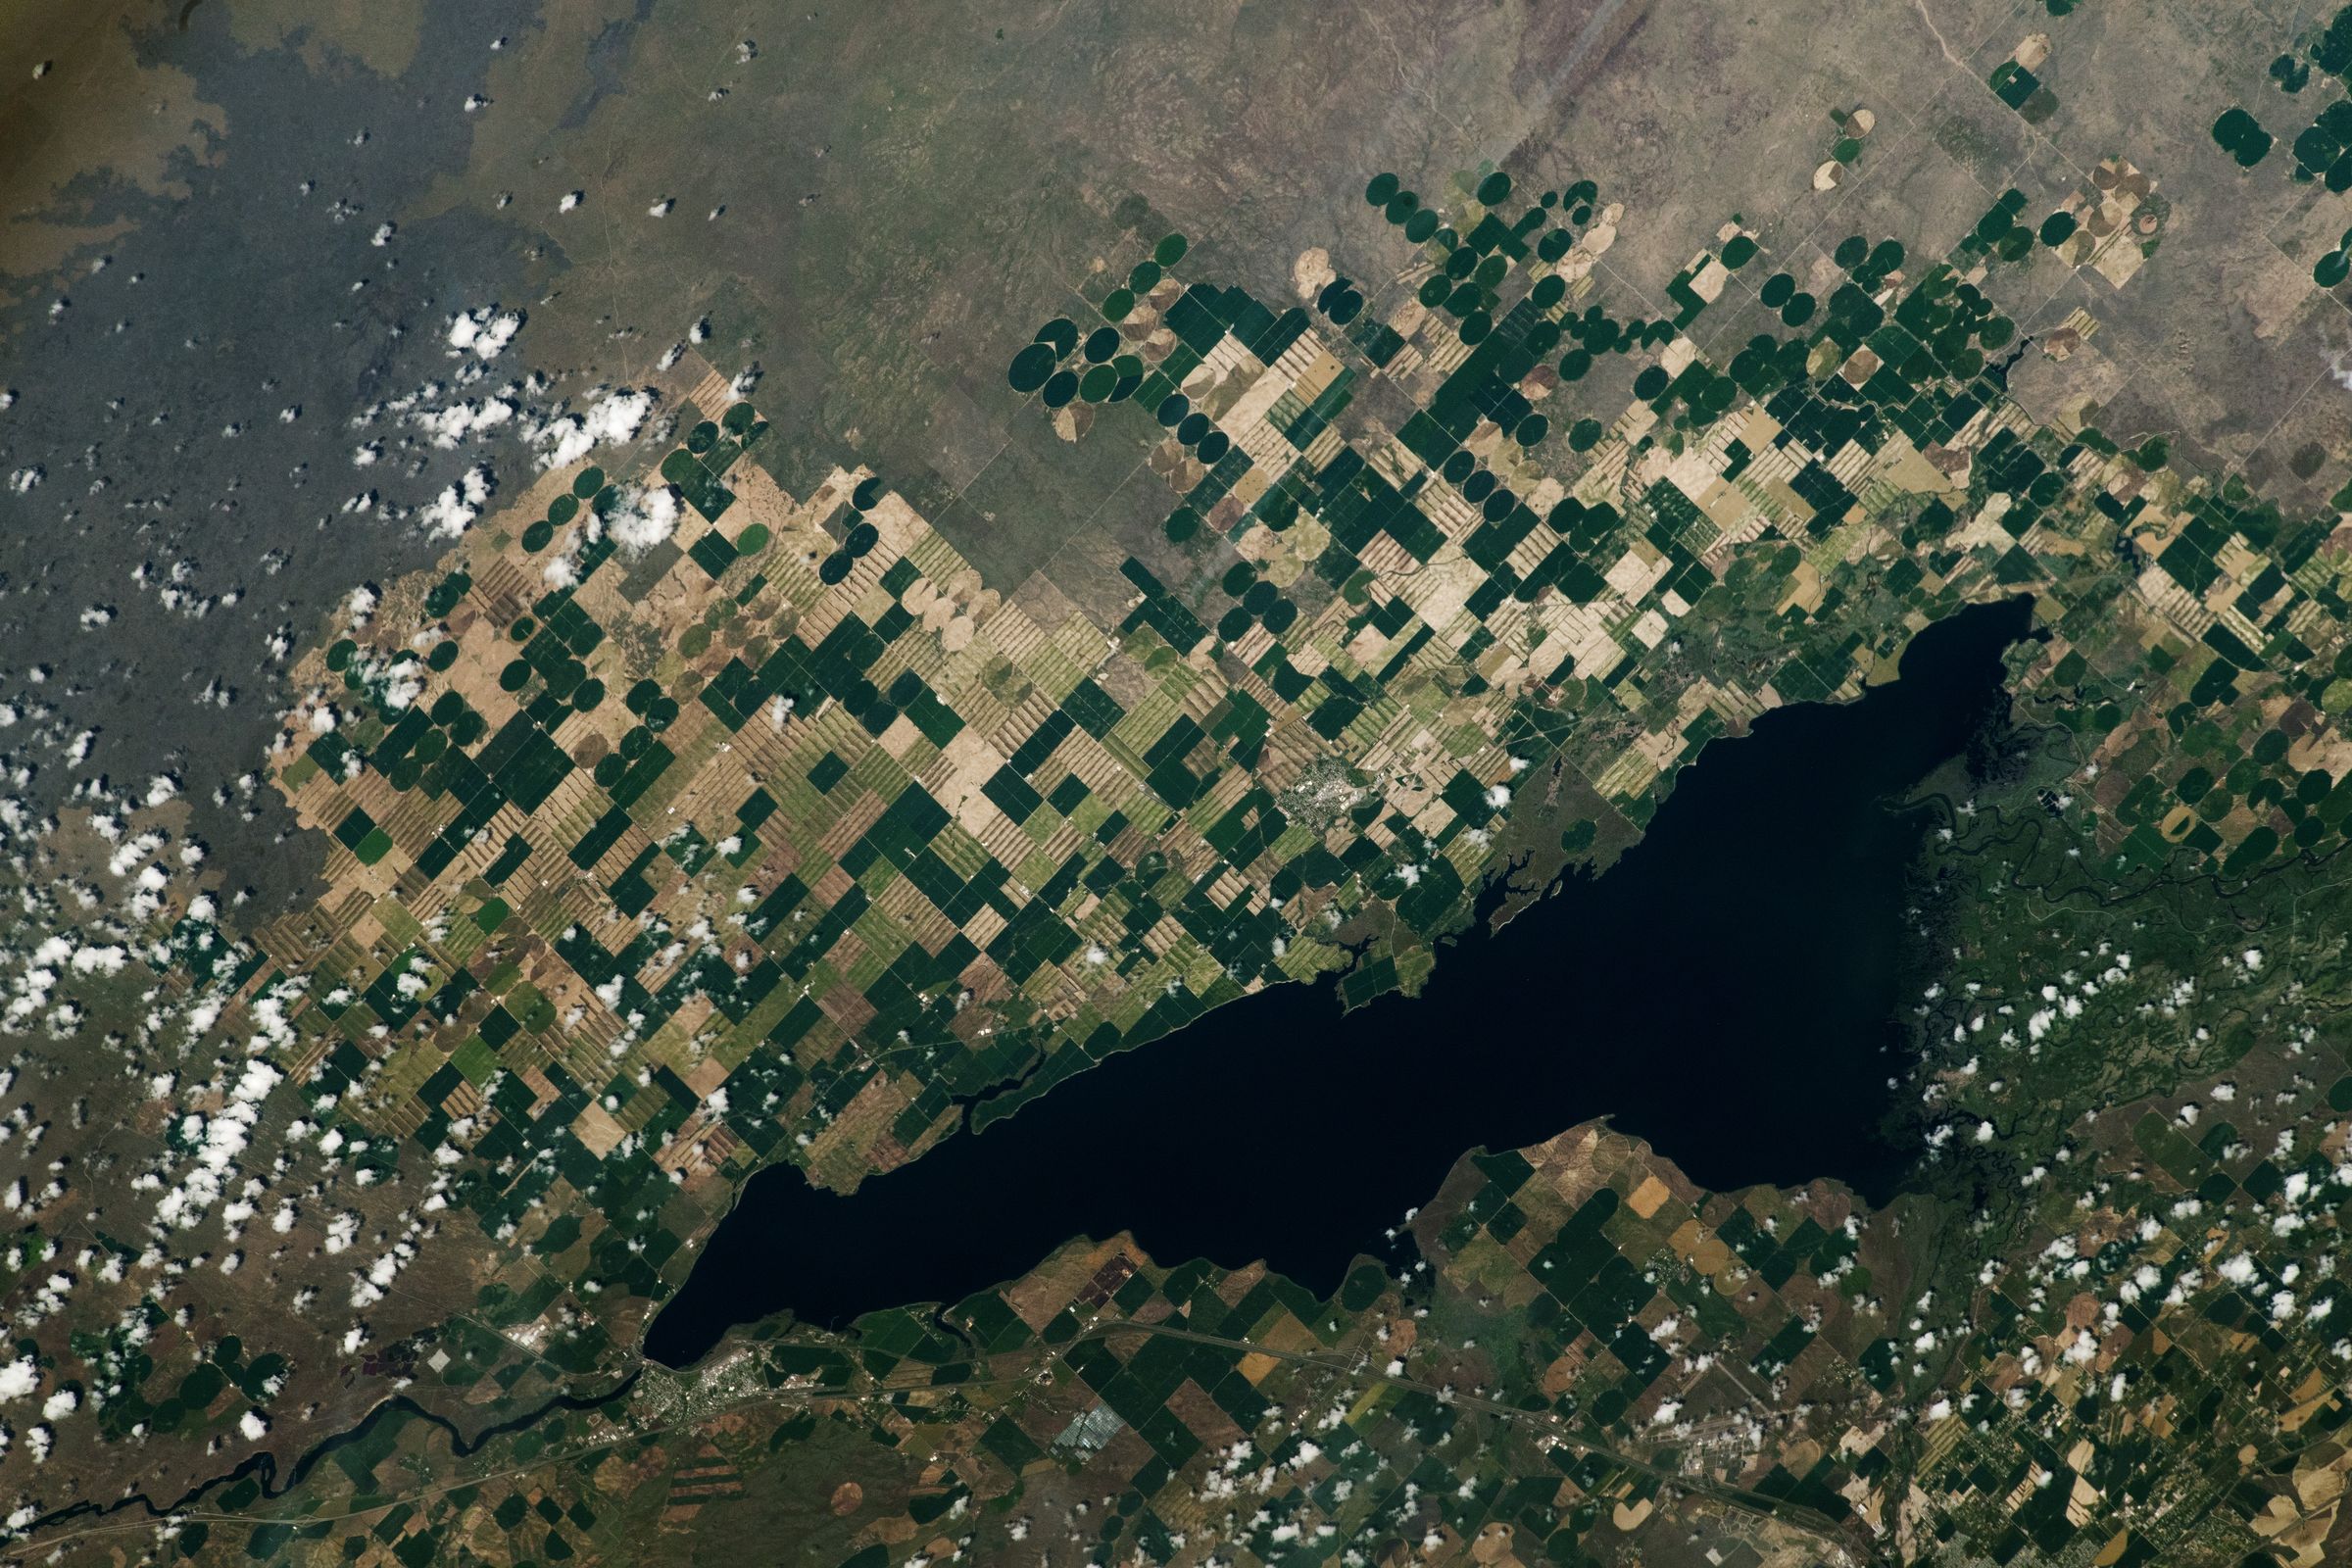
140 core stations in Oregon, Idaho and Washington, 29 buffer stations in neighboring states, and 592,000 station-days of irrigation-season ETrs, 1989–2024.

Farmland around American Falls Reservoir, Idaho, from the International Space Station, June 2023. NASA astronaut photograph ISS069-E-20298.

Proximity versus representativeness

Distance to the nearest station does not tell the full picture

We estimated ETrs uncertainty everywhere with kriging, a geostatistical method that weighs the full configuration of surrounding stations, not only the closest one.

Distance to the nearest station explains 77% of the variation in daily estimation uncertainty. The remaining 23% comes from station configuration: clustered stations duplicate each other's information, while an isolated station carries more weight.

15 mi 5 clustered stations
Near, but redundant. Four of the five stations add little information beyond the first.
40 mi isolated station
Farther, but carries more weight. The network depends on this station over a large area.
Daily versus seasonal-total ETrs

Confidence decays twice as fast for seasonal totals

Confidence retained runs from 0% (the network provides no information; uncertainty equals regional variability) to 100% (the lowest uncertainty physically possible, set by measurement noise).

Daily ETrs anomalies are driven by large-scale weather systems and stay correlated over long distances. Seasonal totals depend on local terrain and climate and decorrelate over shorter distances.

224 km
distance at which daily ETrs confidence falls to 50% (139 mi)
119 km
same threshold for seasonal-total ETrs (74 mi)
◂ Daily ETrsDrag to compareSeasonal-total ETrs ▸
Confidence map for daily ETrs: high nearly everywhere, lower along the far coast and northern Cascades.
Confidence map for seasonal-total ETrs: large low-confidence areas across the Cascades, eastern Washington and central Idaho.
0% confidence retained100%

Kriging-based confidence retained across Oregon, Idaho and Washington: daily ETrs left of the divider, seasonal-total ETrs right of it. White dots: core stations.

Coverage of cropland

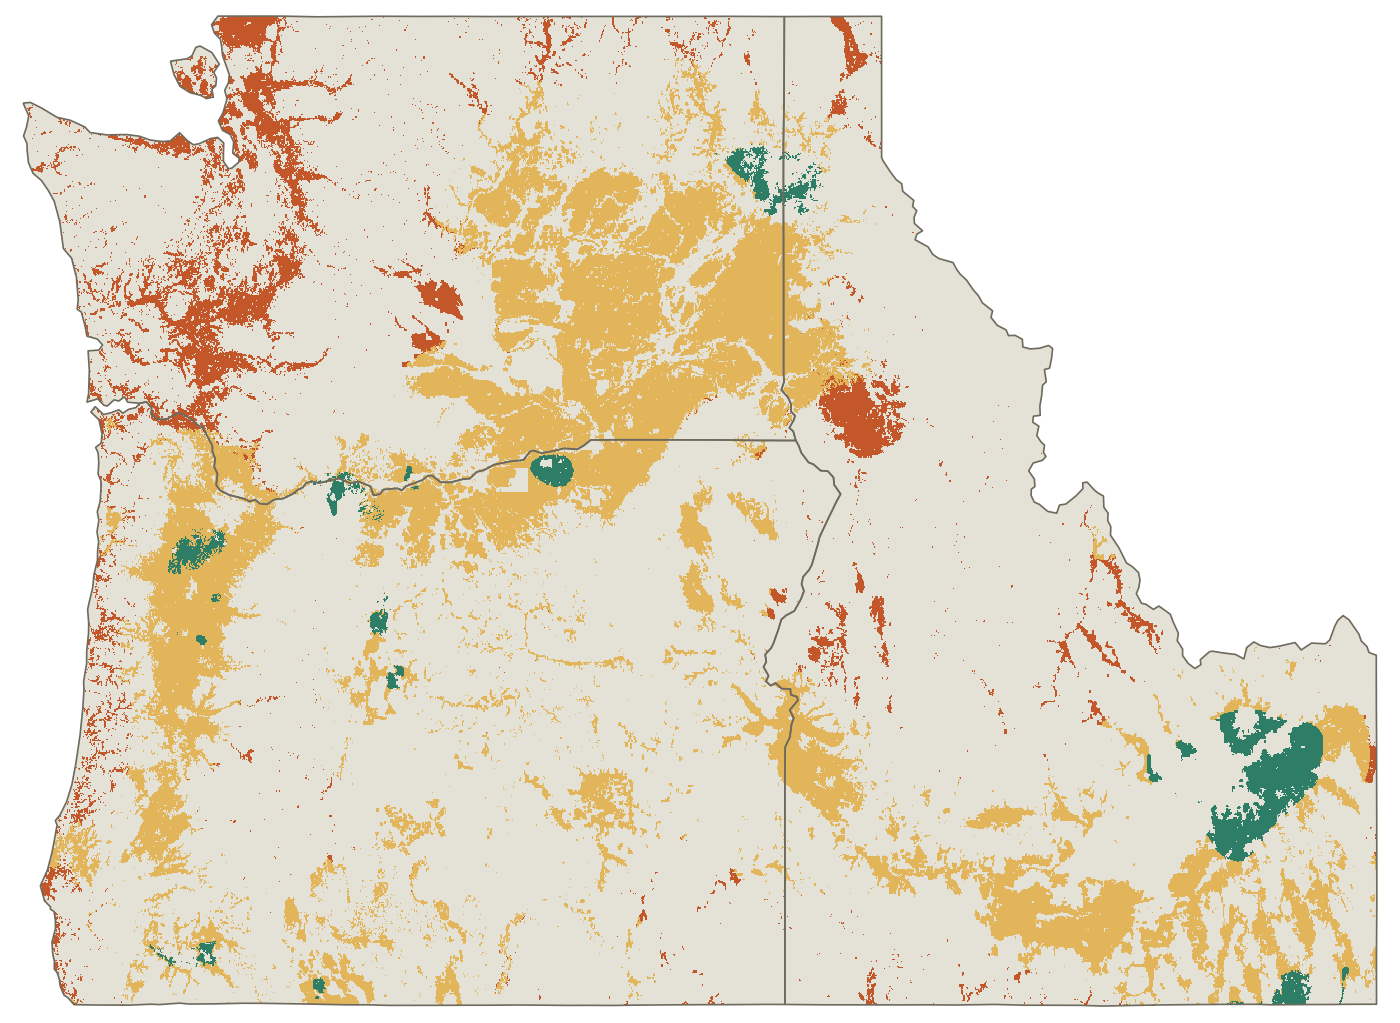
18% of cropland is underserved for daily ETrs; 96% for seasonal totals

Confidence retained places every location between two limits taken from the fitted variogram: 0% at the sill, where the network adds no information, and 100% at the nugget, the measurement-noise floor that no additional station can remove. A value of 80% means the network has removed 80% of the uncertainty it is able to remove at that location.

Cropland was classed as underserved below 80%, adequately served at 80–90% and comfortably served at 90% or above. Because the breaks are tied to each surface's own floor and ceiling rather than to percentiles of the data, a tier means the same share of removable uncertainty for daily and seasonal ETrs. For daily ETrs, the 80% break corresponds to a kriging standard deviation of about 0.84 mm/day, against a floor of 0.68 mm/day and 1.30 mm/day with no station information; 90% corresponds to about 0.77 mm/day. For seasonal totals, 80% corresponds to about 0.41 ac-ft/ac, against a floor of 0.37 and 0.53 with no information.

The same breaks were applied to both surfaces without re-tuning, so differences between them reflect the variograms, not the choice of threshold. A simpler scale anchored at zero instead of the nugget was rejected: with the seasonal surface's large nugget, it falls below 50% within a few kilometers of almost every station.

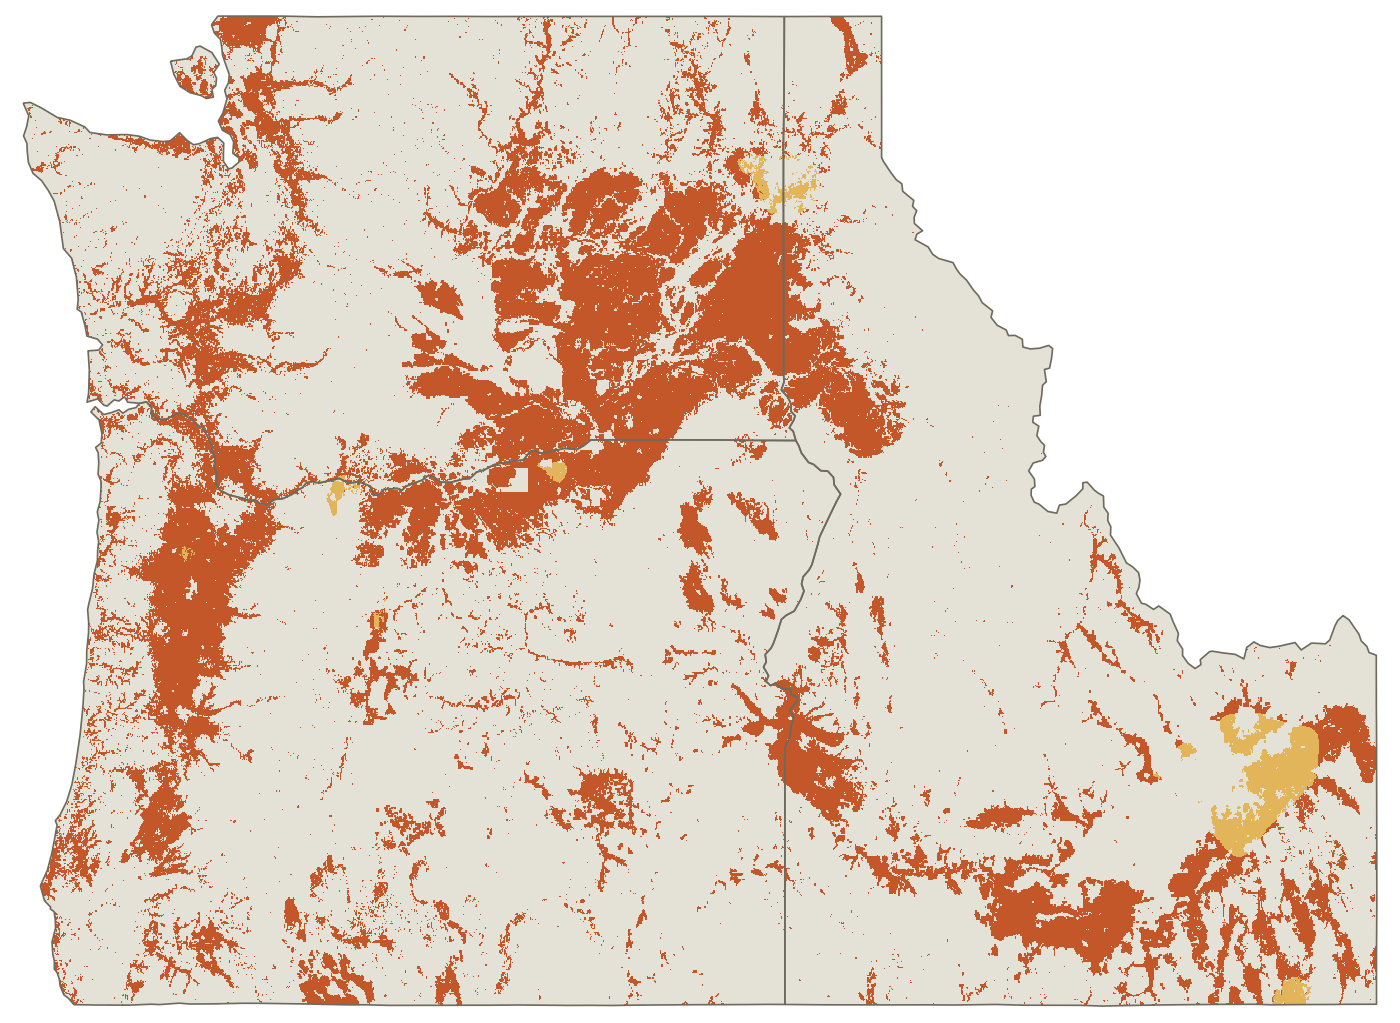
For daily ETrs, 82% of cropland is adequately or comfortably served. Underserved cropland is concentrated along the coast, in parts of the Columbia Basin and in a few interior valleys.

Under the same thresholds, 96% of cropland is underserved for seasonal-total ETrs, a direct result of the shorter correlation distance above.

Of four sub-regions, the Snake River Plain is the best served and the West Cascades and Coastal sub-region the least, reflecting sparse stations relative to high day-to-day variability near the coast.
◂ Daily ETrsDrag to compareSeasonal-total ETrs ▸
Cropland service map, daily: mostly adequately served, with underserved areas along the coast and in northern Washington.
Cropland service map, seasonal totals: nearly all cropland underserved.
Underserved (<80%)Adequately served (80–90%)Comfortably served (≥90%)Not cropland
≈ 2 hrs

In underserved cropland, the typical daily ETrs uncertainty is equivalent to about two hours of center-pivot run time on an average irrigation-season day.

Network growth

The real network is within 1.8–2.6% of an optimal design

We built an optimal network from scratch with the same kriging-variance objective and compared it with AgriMet's actual growth from 20 stations in 1989 to 140 in 2024.

At matched network size, the optimal design reduces cropland-weighted uncertainty by only 1.8–2.6% relative to the real network. Incremental siting decisions over 36 years produced a near-optimal configuration.

Blind validation

2024 additions ranked at a median 93rd percentile

28 stations were added in 2024. A model trained only on pre-2022 data, with no knowledge of those stations, ranked every candidate location by how much a new station there would reduce uncertainty.

The actual 2024 stations fell at a median 93rd percentile of that ranking, against an expected 50th for random siting. Astoria (99th) and Tillamook (98th) ranked highest.

Station importance

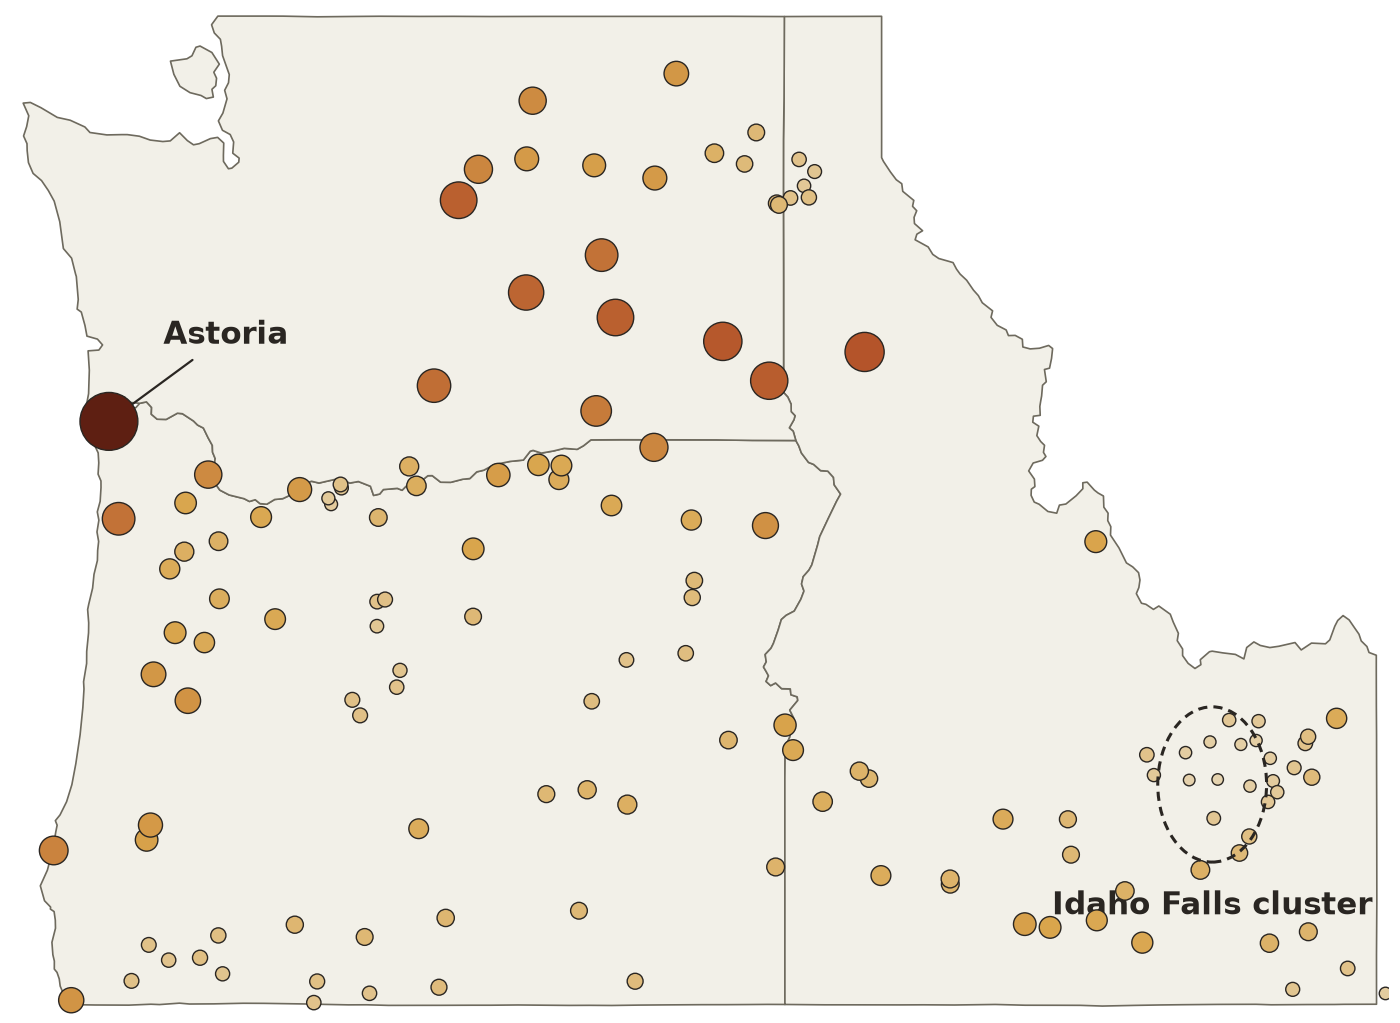
Astoria is the most critical station; the Idaho Falls cluster is the most redundant

Each station was removed in turn to measure the increase in network-wide uncertainty. Removing Astoria produces more than twice the increase of any other station, because it is the only source of information for a long stretch of coastline.

The closely spaced stations near Idaho Falls (Idaho National Laboratory area) are the most redundant group: removing any one changes network uncertainty very little.

Daily and seasonal importance agree only moderately. Salmon, Idaho, and Brookings and Tillamook, Oregon, rank much higher for seasonal totals than for daily values.

Map of the 140 core stations sized and shaded by leave-one-out importance; Astoria on the north Oregon coast is largest; a dashed circle marks a cluster of small dots near Idaho Falls.

Leave-one-out importance for daily ETrs. Larger, darker dots: greater increase in uncertainty when the station is removed.

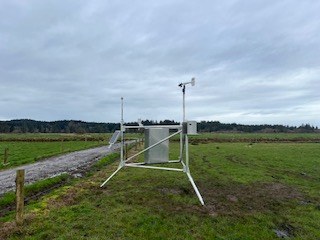
The Astoria AgriMet station: a metal tripod with sensors in a green, grazed pasture.
Astoria station, installed 2024, in green pasture. Photo: U.S. Bureau of Reclamation, AgriMet.
From Part 1 to Part 2

Spatial adequacy assumes every station's surroundings are representative

Part 1 treats each station's ETrs as representative of a well-watered reference surface. If a station sits in dry surroundings, its ETrs is biased, no matter how well placed it is.

Part 2 tests that assumption station by station. Astoria satisfies both: it is the network's most critical location, and its growing-season maximum relative humidity averages 97.5%, among the highest in the network.

Part 2 · Station surroundings

Do station surroundings meet reference conditions?

197 stations across Oregon, Idaho, Montana, Washington, Utah, Nevada, California and Wyoming. Records from 1980 to 2024.

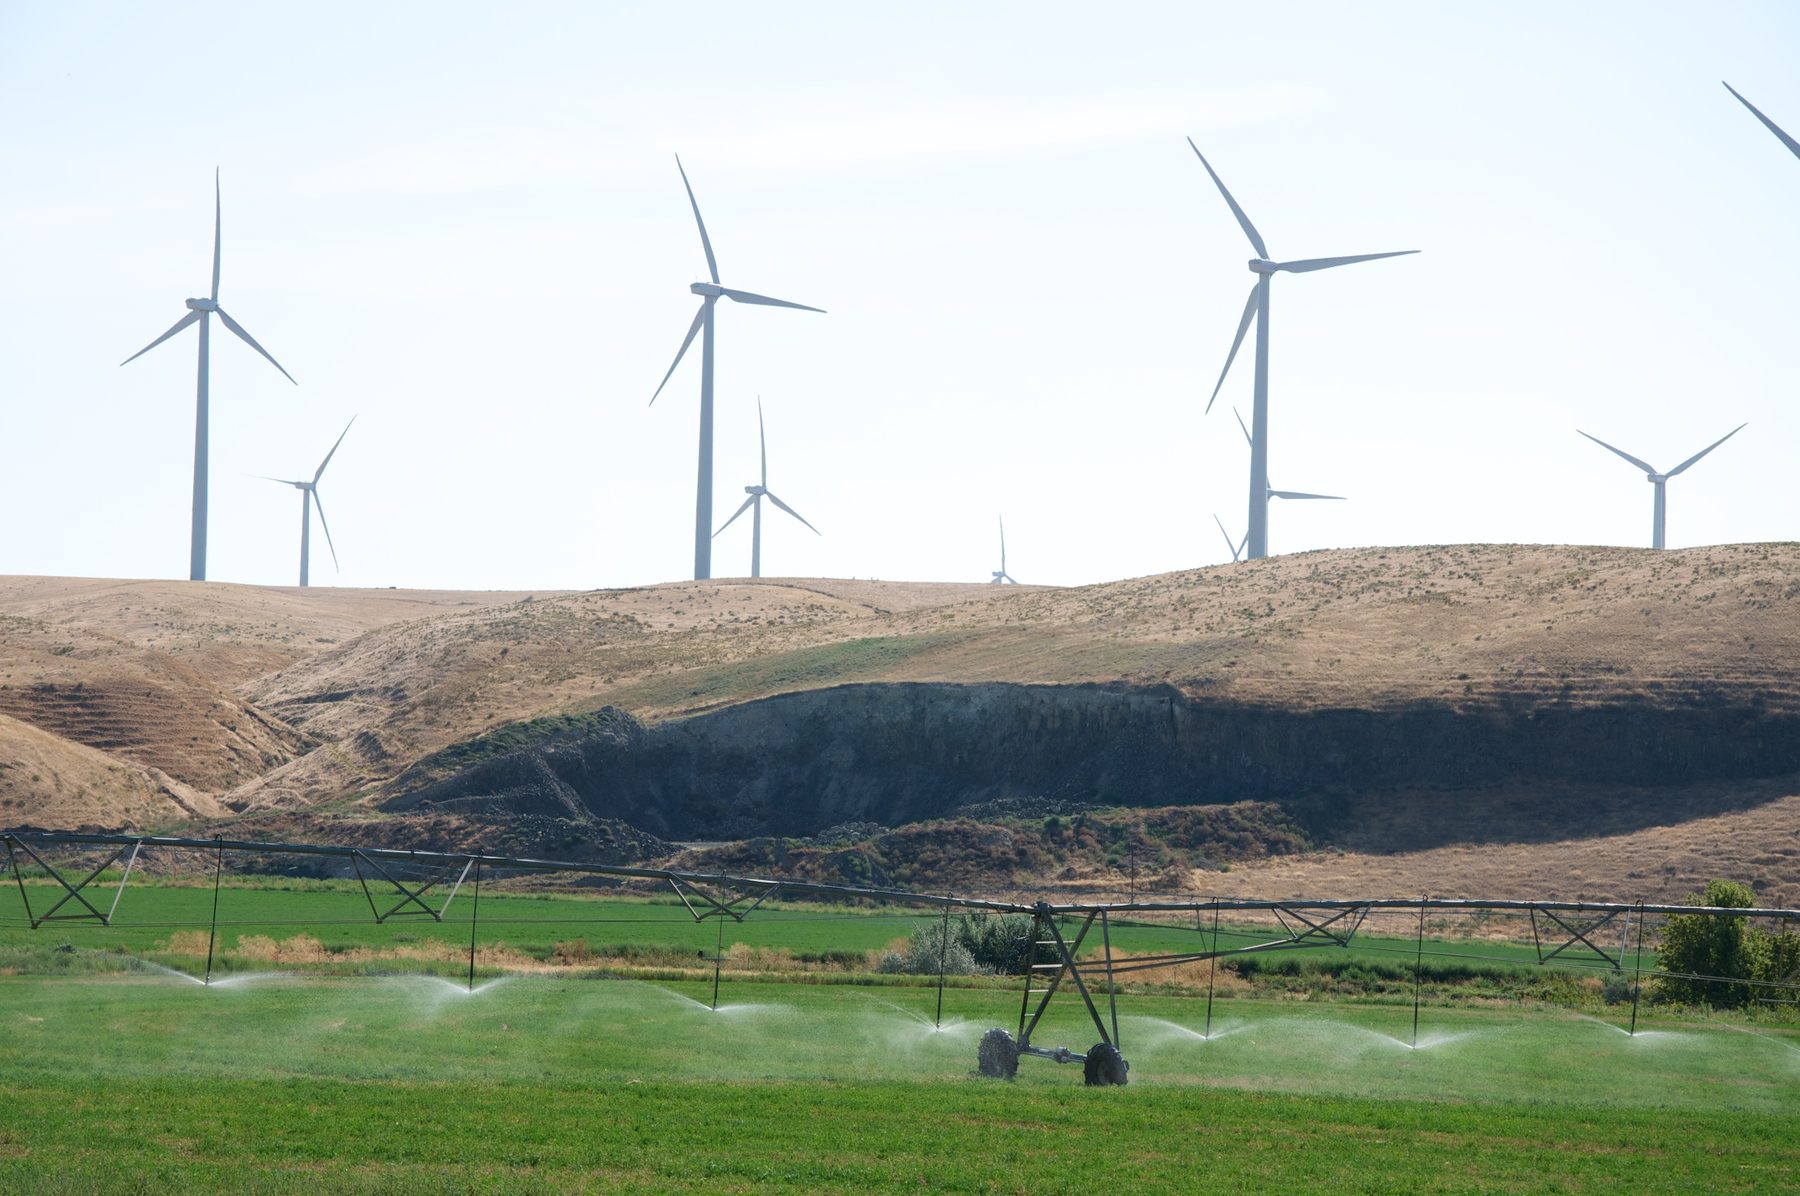
Irrigated fields below non-irrigated hills, Morrow County, Oregon. Photo: Sam Beebe/Ecotrust, CC BY-SA 3.0.

Siting requirements

A reference ET station must sit within a well-watered reference surface

The Penman–Monteith equation applies a low surface resistance. It assumes the surface under the sensors evaporates at the reference rate and that air temperature, humidity and wind near the ground are in equilibrium with that well-watered surface. That holds only when three conditions are met at the site.

Where they are not met, the station records station aridity: a departure of its surroundings from the well-watered reference condition.

  1. Adequate fetch. Uniform vegetation upwind for about 100 times the sensor height in all directions: 150–200 m for sensors at 1.5–2 m. ASCE-EWRI defines the reference as an expanse of at least 100 m. Under neutral and stable conditions the required fetch is closer to 300:1, and well-watered vegetation within about 1 km upwind is needed to condition the boundary layer.
  2. Well-watered, actively transpiring vegetation within that fetch, with no water stress.
  3. Minimal advection of sensible heat and dry air from non-evaporating surfaces. A 5–10 m patch of grass surrounded by dry ground provides essentially no conditioning of temperature and humidity at wind speeds above 2 m/s.
Reference condition met versus violated Left: station within well-watered vegetation; latent heat flux dominates, overlying air is cool and humid, minimum temperature approaches dew point, ETref is representative. Right: station on a small irrigated plot in dry surroundings; sensible heat dominates, warm dry air is advected to the sensors, minimum temperature stays above dew point, ETref is biased high. Latent heat flux dominates Cool, humid air Tmin ≈ Tdew Well-watered fetch in all directions REFERENCE CONDITION MET ETref representative Advection of warm, dry air Sensible heat dominates Irrigated plot, dry fetch REFERENCE CONDITION VIOLATED ETref biased high
Warmer, drier air at the sensorsLess ET in the fetch shifts energy from latent to sensible heat, raising air temperature and vapor pressure deficit.
ETref overestimatedPenman–Monteith ETref rises with temperature and vapor pressure deficit, so the bias is systematic and in one direction.
Errors propagateCrop ET (Kc × ETref), irrigation scheduling, system sizing, water-rights accounting and gridded ET products inherit the bias.
17%

Air temperature and dew point from arid, non-irrigated sites in southern Idaho overestimated seasonal ETrs by 17% (210 mm) relative to nearby irrigated sites. Conditioning weather data to well-watered conditions indicates overstatement of ETos by up to 25% in southern Idaho and 8% in eastern Nevada.

Allen, Pruitt & Jensen (1983); Allen et al. (2021).

Examples

Well-watered fetch versus dry fetch

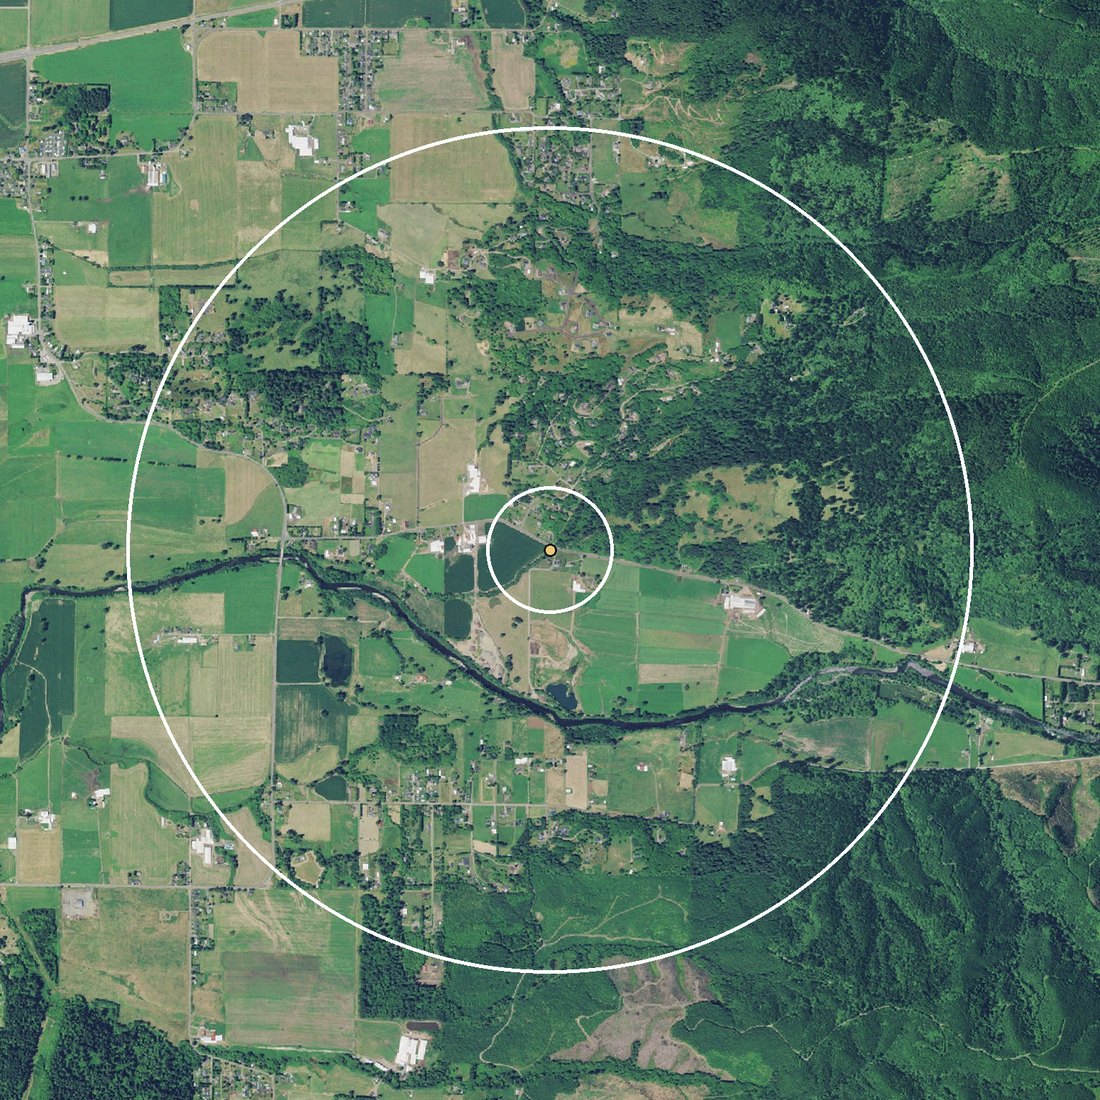
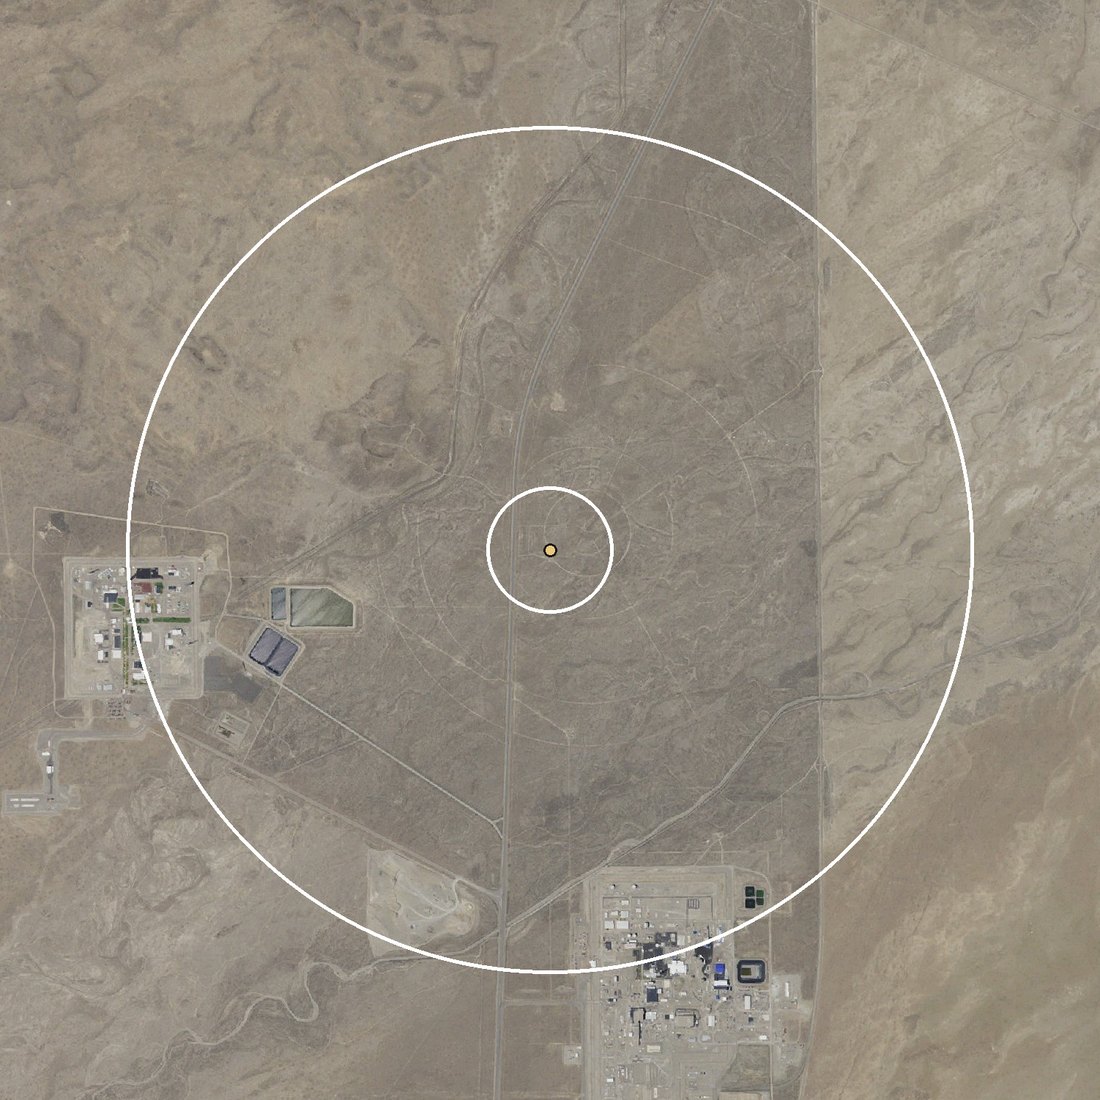
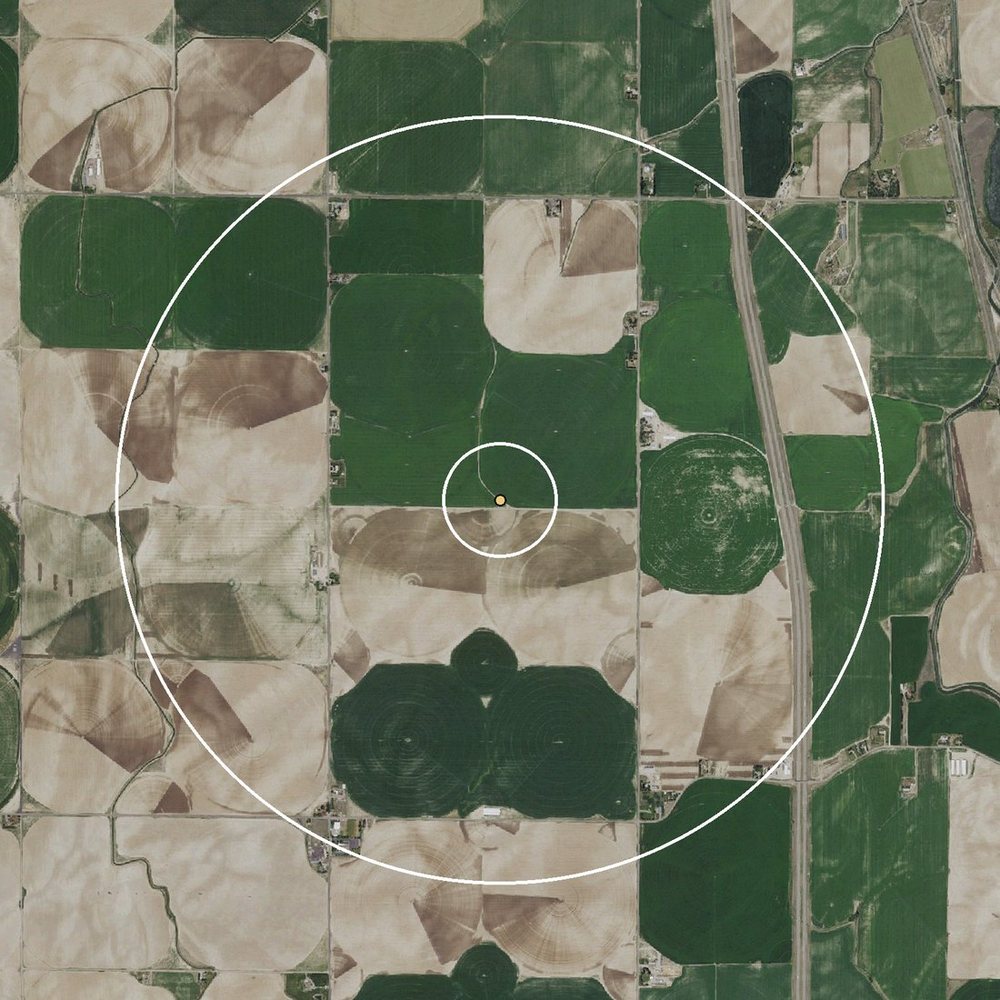
Aerial views centered on each station, with rings at 300 m (the fetch) and 2 km (the surrounding landscape). Values from each station's growing-season record.

Aerial view of the Tillamook station: green pasture and hay fields in every direction within both rings, with a river and forested hills beyond.

Tillamook, Oregon

97.9%Well-watered fetch

Mean growing-season RHmax, the highest in the network. MDD exceeded 2 °C on 2% of growing-season days (2024). Green pasture fills both rings.

Aerial view of the INL Grid 3 station: tan sagebrush desert in every direction within both rings, with no fields or water.

INL Grid 3, Idaho

74%Dry fetch

Mean growing-season RHmax. MDD exceeded 2 °C on 73% of growing-season days (2014–2024). Sagebrush desert on the Idaho National Laboratory site, with no cropland or water within 2 km; laboratory facilities sit near the outer ring.

Inner ring: 300 mOuter ring: 2 km

Imagery: USGS National Map, orthoimagery (public domain).

Diagnostic framework

Four indicators: two describe the surface, two describe the atmospheric response

No single variable captures station aridity. Surface indicators show what surrounds a station; humidity indicators show whether the air at the sensors behaves as it would over a well-watered surface, and provide a multidecadal record that satellites cannot.

Surface · Sentinel-2, 10 m

NDVI

Normalized difference vegetation index, (NIR − Red)/(NIR + Red), a measure of green, actively transpiring vegetation. Growing-season values of 0.6 or more indicate dense vegetation consistent with reference conditions; 0.4 or less indicates sparse or moisture-limited vegetation.

Surface · Google Dynamic World, 10 m

Land use and land cover

Share of crops, grass, trees, shrub and scrub, built, bare and water around each station. Identifies the type of surface, but not its water status: cropland may be irrigated or dryland.

Atmosphere · station record

Mean dew point depression (MDD)

MDD = Tmin − Tdew. Over a well-watered surface, nighttime cooling brings air close to saturation, so daily minimum temperature approaches the dew point. Over dry surroundings, Tmin stays well above Tdew. Summarized as the share of growing-season days with MDD above 1, 2, 3, 4 and 5 °C.

Atmosphere · station record

Nighttime humidity (RHmax)

Daily maximum relative humidity, normally reached near dawn. It approaches 100% at reference sites; values consistently below 80–90% indicate aridity of the measurement environment or sensor calibration drift. Summarized as the share of days below 90, 80, 70 and 60%.

Surface indicators were computed in circular buffers of 100, 300, 1,000 and 2,000 m, spanning the local, fetch, boundary-layer and regional scales. Humidity indicators were computed for the full year and for the growing season (1 April to 30 September).

Records were quality-controlled with the open-source agweather-qaqc package. Wind speed was adjusted to 2 m using the anemometer height in effect on each date, and reported station elevations were checked against the USGS 10 m elevation model.

Under reference conditions in arid and semiarid climates, Tdew can still be 2–5 °C below Tmin because of regional dryness, so no single MDD threshold transfers between regions. This is why the framework uses several thresholds and combines indicators.

197
stations: OR 70, ID 52, MT 27, WA 21, UT 19, NV 4, CA 2, WY 2
3,510
station-years of humidity records (from 1980)
3,336
station-years of dew point records (from 1989)
4
buffer radii, 100 m to 2 km, for 2021–2024 satellite composites
Finding 1 · Land cover

Cropland dominates around two-thirds of stations, but most surroundings are mixed

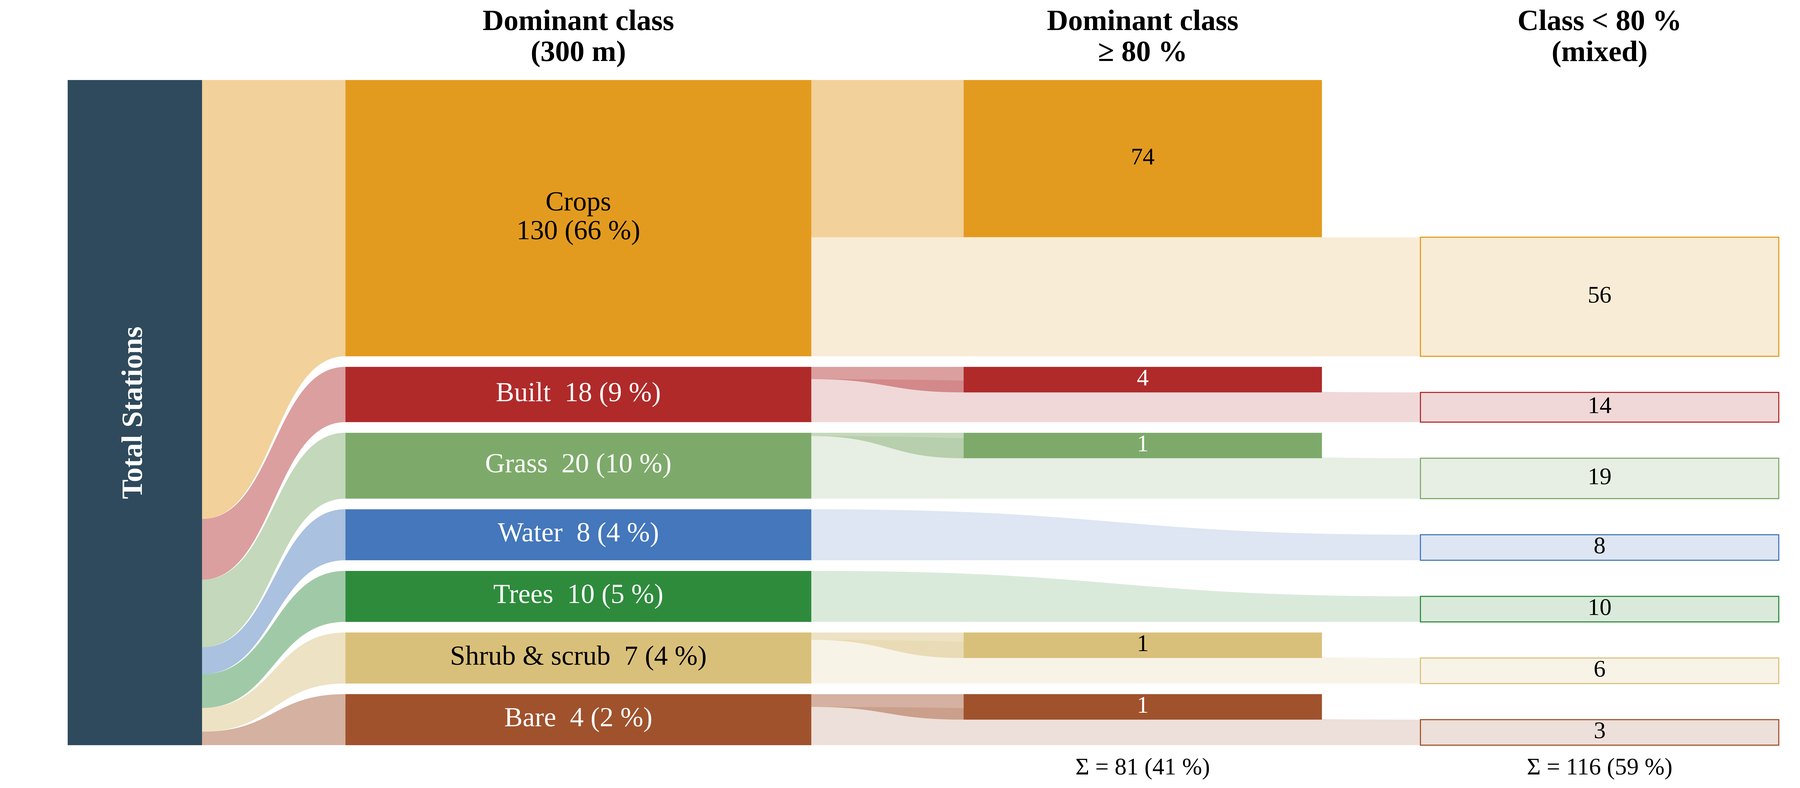
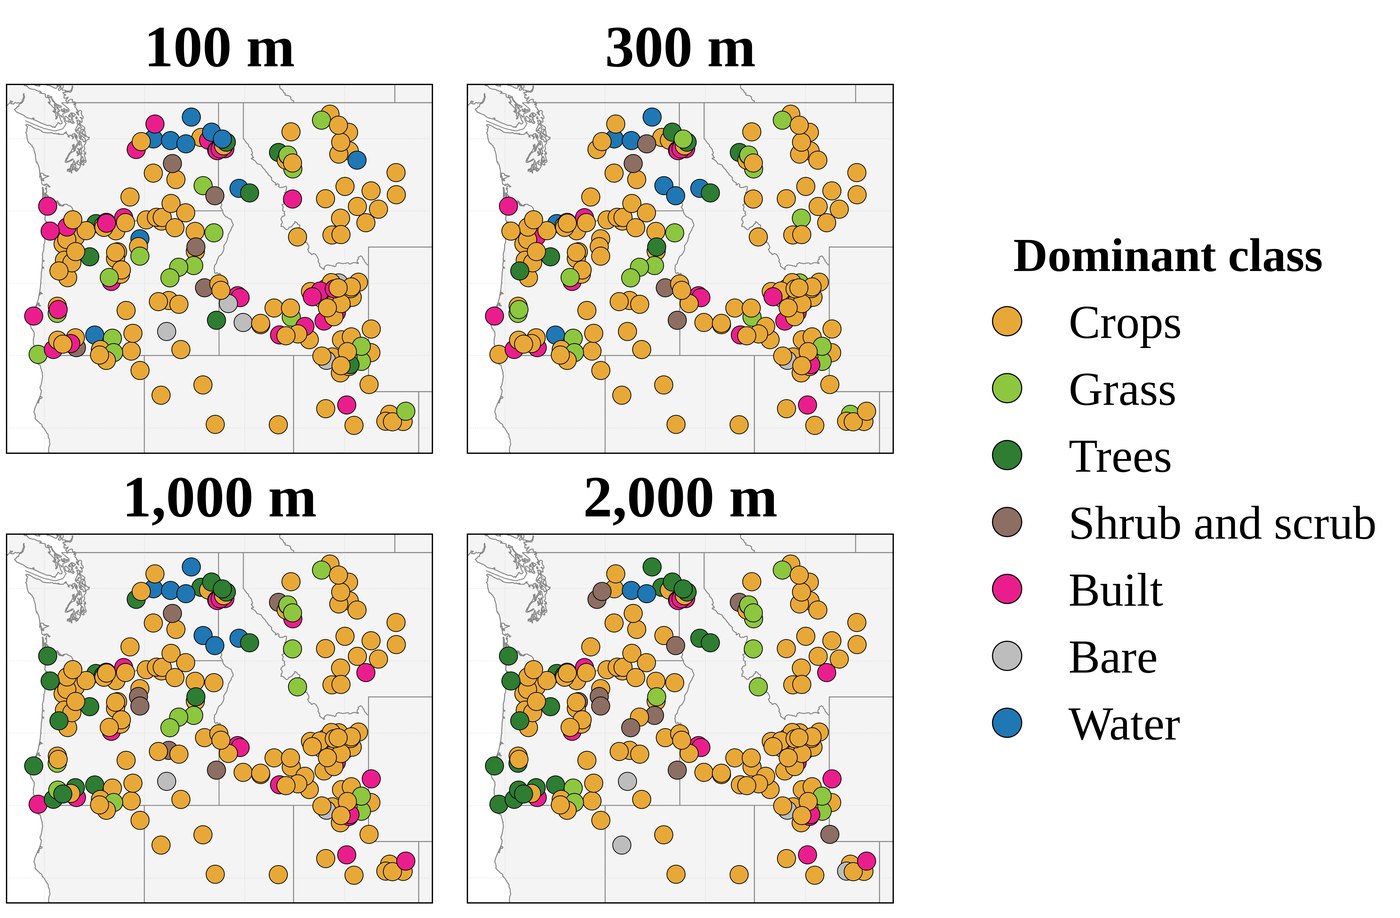
At the 300 m buffer, cropland is the dominant class at about two-thirds of stations, consistent with the network's purpose. Built surfaces and grass are next, at roughly 10% of stations each.

Only 41% of stations have a single class covering 80% or more of the 300 m buffer. The other 59% sit in mixed surroundings, where part of the fetch is a different surface from the one beneath the sensors.

Sankey diagram: of 197 stations, 130 have crops as the dominant 300 m class, then grass 20, built 18, trees 10, water 8, shrub and scrub 7, bare 4; 81 stations (41%) have a dominant class covering at least 80% of the buffer and 116 (59%) are mixed.

Dominant land cover within 300 m of each station (left), split into stations where one class covers at least 80% of the buffer (center) and mixed stations (right). Google Dynamic World, growing seasons 2021–2024.

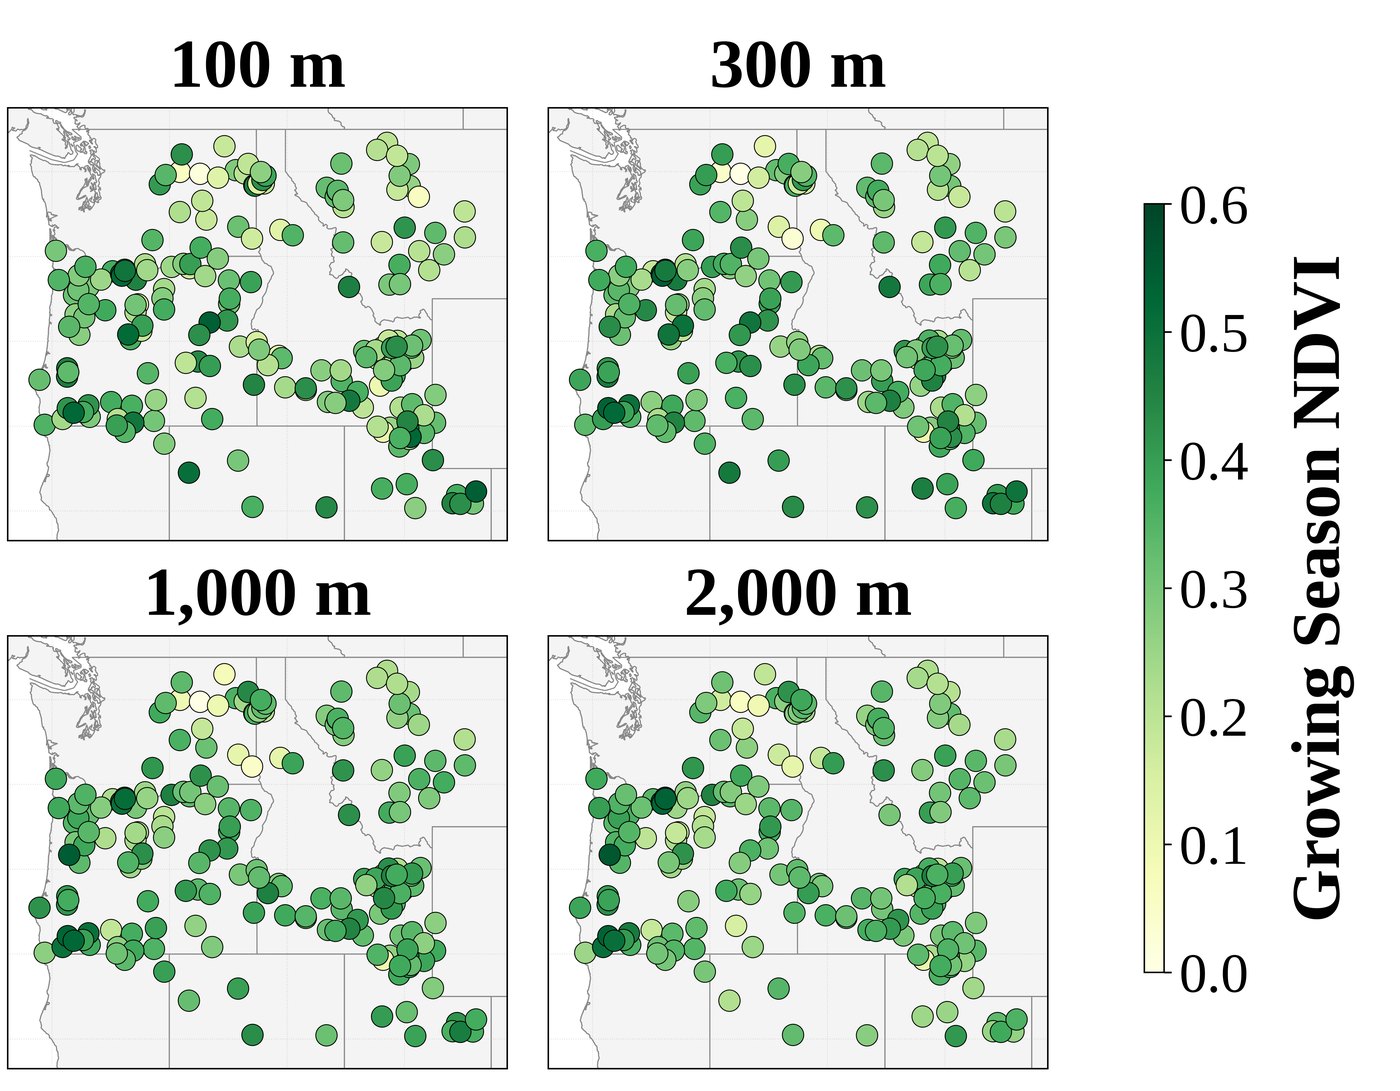
Four maps of dominant land cover at 100, 300, 1,000 and 2,000 m around each station; crops dominate, with built, water and trees at some stations. Four maps of mean growing-season NDVI at 100, 300, 1,000 and 2,000 m around each station; values mostly 0.2 to 0.5, higher in western Oregon.

Dominant land cover (left) and mean growing-season NDVI (right) at four buffer radii for all 197 stations.

Finding 2 · Vegetation

Mean NDVI around stations is 0.33, below the 0.6 associated with reference vegetation

Growing-season NDVI in the 300 m buffer averaged 0.33 across the network (median 0.34, range about 0 to 0.55). No station's mean reached 0.6.

NDVI was highest in the wetter western Oregon and western Montana sectors, where values of 0.50–0.55 corresponded to well-irrigated alfalfa and row crops. Stations next to open water or bright built surfaces had values near zero.

Finding 3 · Nighttime humidity

At the median station, MDD exceeds 2 °C on 42% of growing-season days

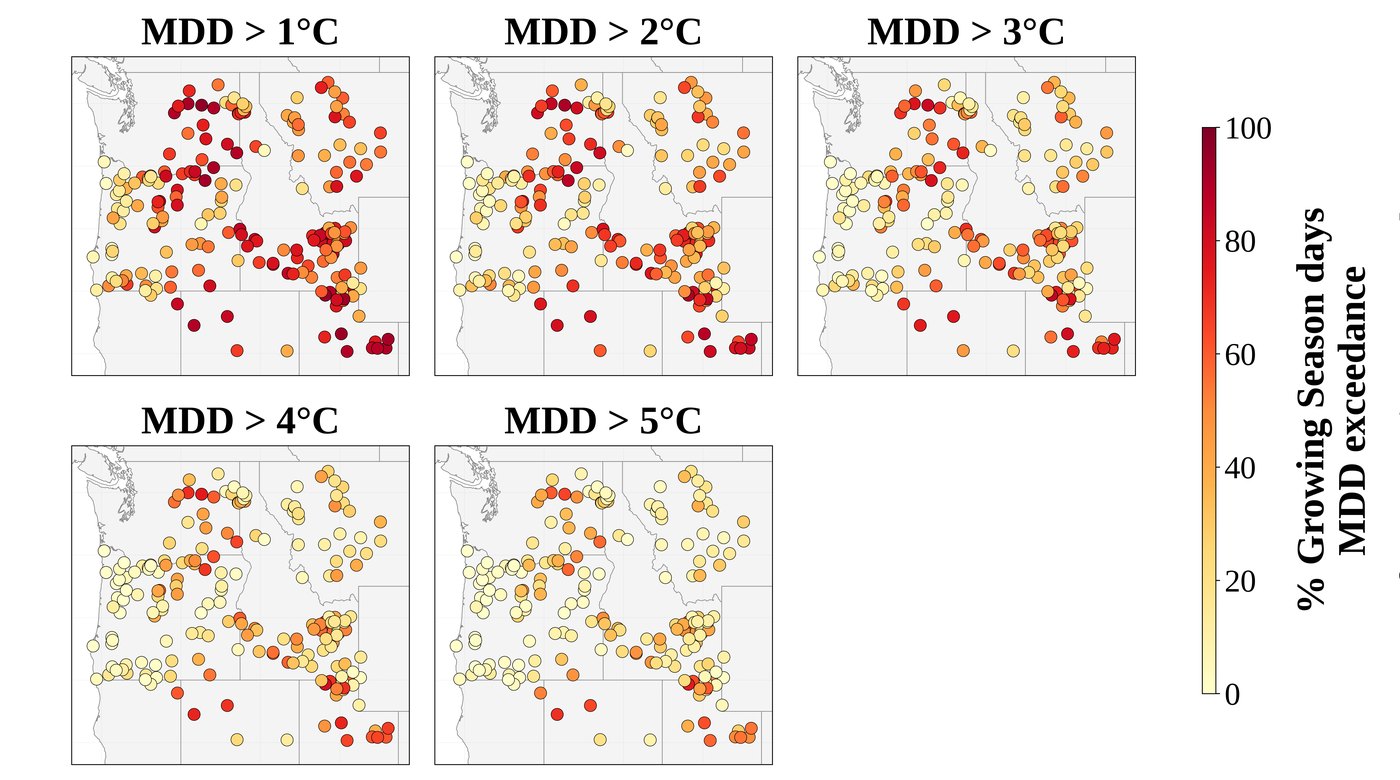
Growing-season MDD averaged 2.08 °C (median 1.81 °C; range −2.45 to 10.24 °C). MDD exceeded 2 °C on a median 42.4% of growing-season days, and exceeded 5 °C on a median 14.0%. At 70 of 197 stations, MDD exceeded 5 °C on more than a quarter of growing-season days.

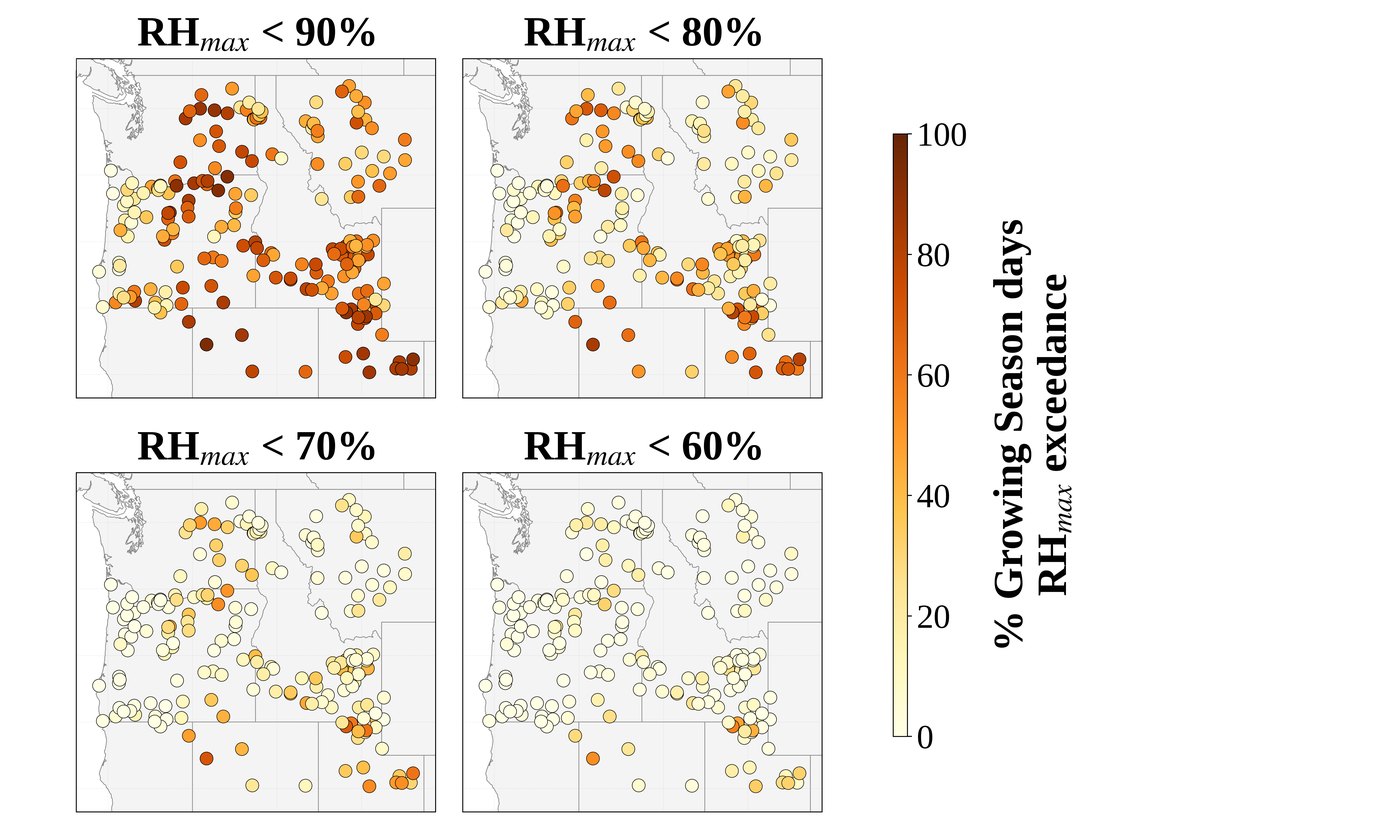
Growing-season RHmax averaged 84.6% (median 86.3%), below the 95–100% expected at well-irrigated sites. RHmax fell below 80% on a median 25.2% of growing-season days. The lowest values were in the Great Basin (Snowville South, UT, 56.8%); the highest on the Oregon coast (Tillamook 97.9%, Astoria 97.5%, Bandon 97.2%).

The two humidity indicators agree closely across stations (Spearman ρ = −0.945), confirming they track the same process. The frequency of RHmax below 80% matches or exceeds values reported for the Oklahoma Mesonet, where station aridity was first characterized at network scale.

Five maps of the share of growing-season days with MDD above 1, 2, 3, 4 and 5 °C at each station. Four maps of the share of growing-season days with RHmax below 90, 80, 70 and 60% at each station.

All thresholds: share of growing-season days with MDD above 1–5 °C (left) and RHmax below 90–60% (right).

Finding 4 · Local, not regional

Nearby stations under the same climate differ by a median 14 percentage points

We compared 77 station pairs less than 25 km apart and within 150 m in elevation, so that both stations share the same regional climate. The share of growing-season days with MDD above 2 °C differed by a median 14.1 percentage points, and by up to 75.3.

Differences this large between neighbors cannot come from regional weather. They reflect the surface around each station.

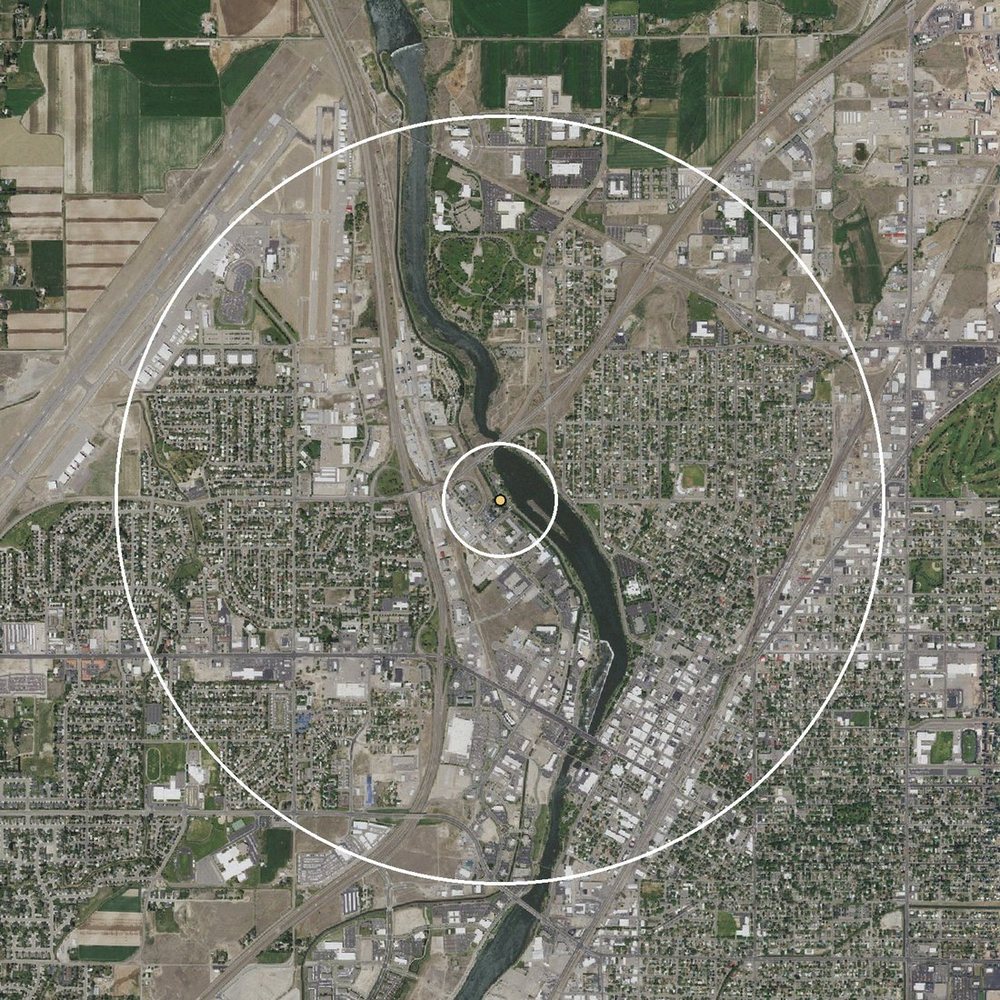
Example pair from the study data, 9 km apart: the Idaho Falls station, in town beside the river, exceeded 2 °C on 77% of growing-season days; Osgood, within irrigated pivots, on 19% (shared years 2014–2024).

Aerial view centered on the Idaho Falls station: houses, roads, rail yards and the Snake River.
Idaho Falls77%MDD > 2 °C
Aerial view centered on the Osgood station: green center-pivot circles and harvested fields.
Osgood19%MDD > 2 °C
Inner ring: 300 mOuter ring: 2 km

Imagery: USGS National Map, orthoimagery (public domain).

Finding 5 · Surface and humidity

Greener fetch, fewer high-MDD days; the link strengthens out to 2 km

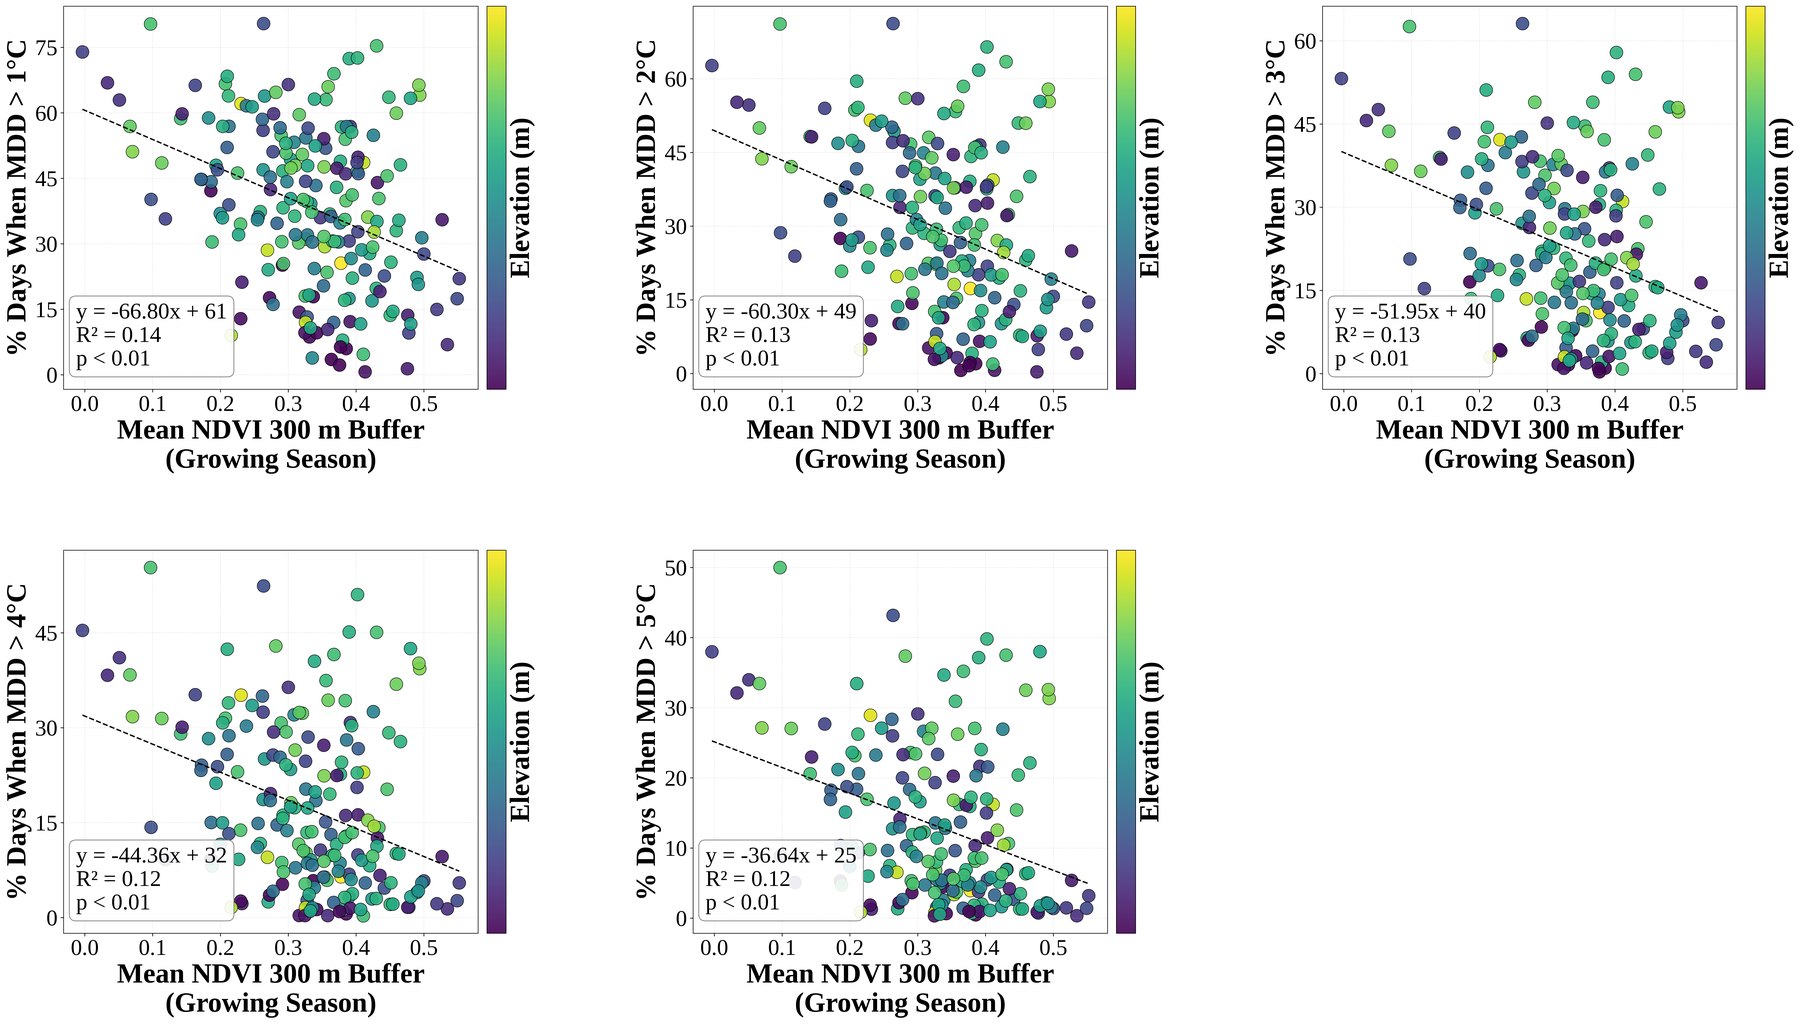
Growing-season NDVI at 300 m was negatively correlated with MDD (Spearman ρ = −0.32). Regression slopes were negative at every MDD threshold, with R² of 0.12–0.14.

The relationship strengthened as the buffer widened. For MDD above 5 °C, R² rose from 0.10 at 100 m to 0.24 at 2,000 m, and the correlation with mean MDD reached ρ = −0.43 at 2 km. The surrounding landscape well beyond the immediate footprint conditions the air reaching the sensors.

Class means rose steadily from tree-dominated surroundings (mean MDD −0.1 °C; above 2 °C on 19% of days) through grass, cropland and shrub–scrub to bare ground (6.1 °C; 76% of days).

R² values are modest because elevation, regional advection, soil water and crop stage also affect humidity. NDVI is a necessary but not sufficient indicator, which is why it is paired with humidity indicators. RHmax relationships followed the same pattern with lower R².

Five scatter plots of mean growing-season NDVI at 300 m versus the share of days with MDD above 1 to 5 °C, each with a negative regression line, R squared 0.12 to 0.14.

Mean growing-season NDVI (300 m) against the share of growing-season days with MDD above each threshold. One point per station, colored by elevation.

What this means

What this means for water users and the network

A station adds to the network only if it is in the right place and its surroundings let it measure the air over a well-watered field. Where the nearest station sits in dry surroundings, coverage on the map is better than coverage in practice. The steps below address both.

Station locations

Show how much to trust the number at each farm

Water-use estimates for a field between stations carry an uncertainty that depends on how far away the stations are and how they are spread. Publishing a simple map of that uncertainty next to the estimates would let growers see whether their number is solid or rough. In underserved cropland, a typical daily error equals about two hours of center-pivot run time.

Station locations

Use the map to choose where the next station goes

The method in this study picked out the same places AgriMet actually chose for its 2024 stations, so it can rank future locations the same way. Daily irrigation scheduling and season-long water planning depend on different stations, so each siting or funding decision should say which of the two it is meant to improve. When budgets tighten, the same ranking shows where stations overlap and which ones the network can least afford to lose.

Both

Check a site's surroundings before installing a station

A spot can be ideal on the coverage map and still give biased readings if the land around it is dry. Before installing, check satellite images of the surrounding few hundred meters to two kilometers, and confirm the fields are actually irrigated, not just farmed. Sites in the middle of large irrigated areas are best; field edges, towns and shorelines are not.

Station surroundings

Label each station's data quality

The humidity indicators in this study can be computed from records AgriMet already keeps. Publishing a simple rating for each station (meets reference conditions, marginal, or does not) and flagging days when the air was too dry would let users judge readings before relying on them, without any new equipment.

Both

Give satellite water-use maps a sound starting point

Satellite-based water-use maps, such as OpenET, are adjusted to match measurements at hundreds of farm weather stations, including AgriMet stations. If some of those stations sit in dry surroundings, their high readings are carried into the maps for every field nearby. Using only stations that meet reference conditions for this adjustment, and adding stations where none exist, would improve those maps for far more farms than the stations serve directly.

Station surroundings

Re-check stations every year

The land around a station changes as fields rotate crops, sit fallow, switch to dryland farming or are developed. The indicators can be updated each year from new satellite images and the station's own records, so a station's rating should be reviewed regularly rather than set once.

Summary

An adequate network, with representative surroundings at every station

Part 1 · Spatial adequacy
Near-optimal for daily ETrs
  • 82% of cropland is adequately or comfortably served for daily ETrs; 96% is underserved for seasonal totals.
  • The real network is within 1.8–2.6% of an optimal design.
  • 2024 additions ranked at a median 93rd percentile in a blind test.
  • Astoria is the most critical station; the Idaho Falls cluster the most redundant.
Part 2 · Station surroundings
Widespread departure from reference conditions
  • Median station: MDD above 2 °C on 42% of growing-season days; mean RHmax 84.6%.
  • Mean NDVI at 300 m is 0.33; no station reaches 0.6.
  • Neighboring stations differ by up to 75 percentage points, a local surface effect.
  • Diagnostics can be reported with ETref using existing data.

Both assessments rely only on station records and public terrain, climate and satellite data, so they can be applied to other reference ET networks.